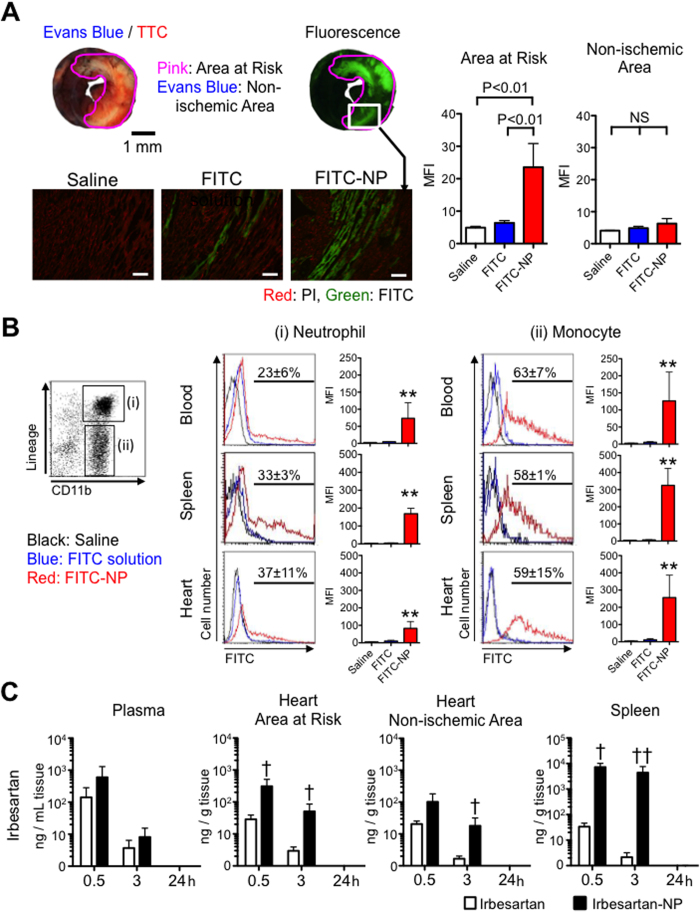
Figure 3. PLGA nanoparticles as a drug delivery system for IR injury.
(A) Representative light (upper left) and fluorescence (upper right) stereomicrographs of whole hearts 3 hours after intravenous injection of FITC-NP. Fluorescence photomicrographs (lower panels) of cross-sections from hearts treated with saline, FITC solution and FITC-NP. Green indicates FITC, and red indicates nuclei (PI). Scale bar: 20 μm. Column graphs illustrate quantification of the FITC mean fluorescence intensity (MFI) in the area at risk and non-ischemic area. Data shown as mean ± SD (N = 4 mice per group). Data are compared using one-way ANOVA followed by Bonferroni’s multiple comparison tests. (B) Histograms illustrate the uptake of FITC-NP (red) in the respective cells (columns) and organs (rows). Column graphs illustrate quantification of the FITC MFI in the respective cells. Data shown as mean ± SD (N = 5 mice per group). The percentages of FITC-positive cells is reported as mean ± SEM (N = 3 mice per group). (C) Plasma, myocardial tissue (area at risk, non-ischemic area) and spleen concentrations of irbesartan after 30 minutes, 3 hours and 24 hours of intravenous injection of irbesartan alone or irbesartan-NP. Data shown as mean ± SD (N = 4–5 mice per group). *P < 0.05 vs. saline, **P < 0.01 vs. saline using one-way ANOVA followed by Bonferroni’s multiple comparison tests. †P < 0.05 vs. irbesartan solution, ††P < 0.01 vs. irbesartan solution using two-way ANOVA followed by Bonferroni’s multiple comparison tests. All results are average of three replicates. NS: not significant.

