Fig. 6.
Translation dynamics in live neurons.
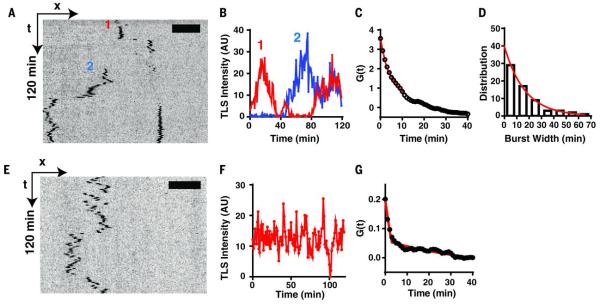
Flag-SINAPS reporter was expressed in primary hippocampal neuron and imaged live. (A) The kymograph of two flag-SINAPS TLSs in dendrites from time-lapse imaging (movies S11 to S13). (B) The integrated intensities of the two TLSs (labeled as 1 and 2, respectively) showing bursting behaviors. (C) Fitting the autocorrelation function of the integrated intensity (average of 61 TLSs) yielded the residence time T = 170 ± 50 s, initiation rate = 2.1/min, and the average length of translation bursts τon = 13 min. (D) The translation burst size was directly measured for tracks showing complete off-on-off cycles. Exponential fit of the histogram yielded the average length of the burst τon = 17 min. (E) Kymograph, (F) integrated intensity trace, and (G) autocorrelation function of constitutive TLS (defined as translating more than 90% of the time during the 2-hour imaging window, average of 13 TLSs). Fitting of correlation function yielded T = 164 ± 24 s, initiation rate = 2.9/min. The length of translation burst was τon >120 min, which is consistent with a constitutive translation.

