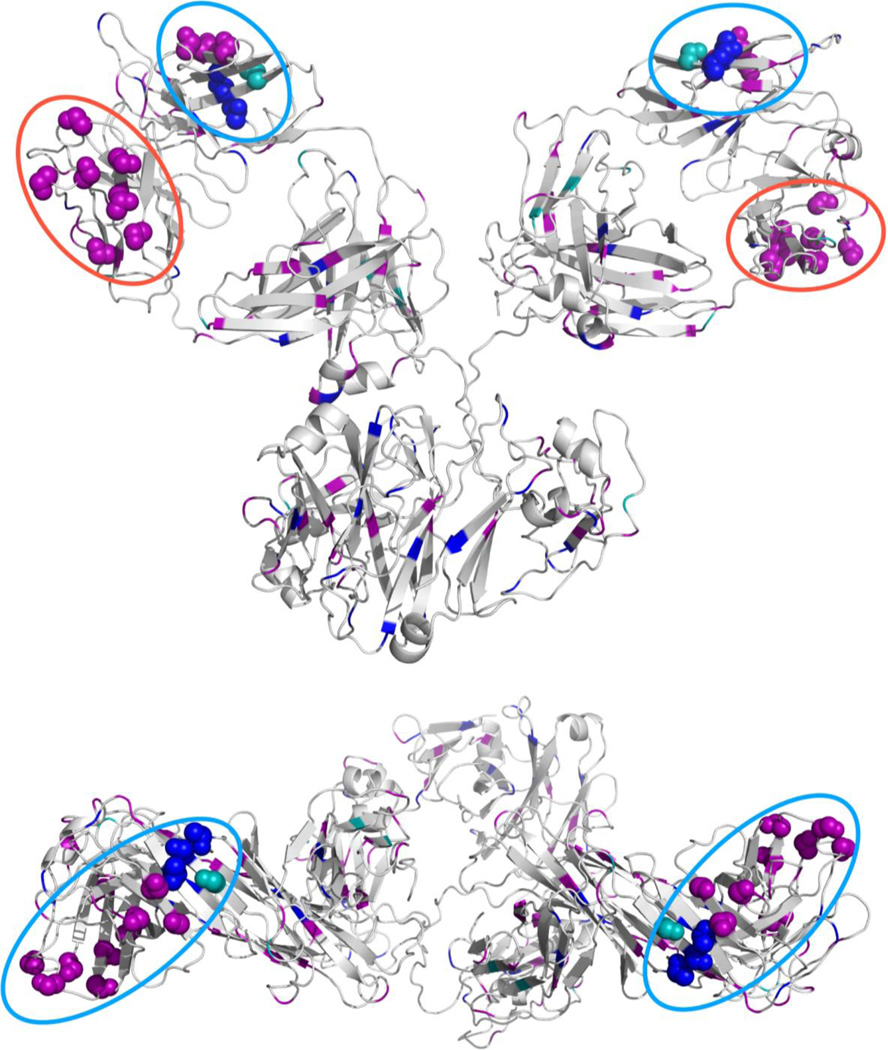
Figure 3.
Cartoon representations of IgG1 homology model. Side view (top) and top view (bottom). Spheres represent residues that are likely at the aggregate interface. Colors represent the magnitude of the reduction (Purple: >80%, Blue: 40–80%, and Teal: 10–40% reduction in labeling). The likely interfaces on the VL and VH domains are circled (VL: blue and VH: red).

