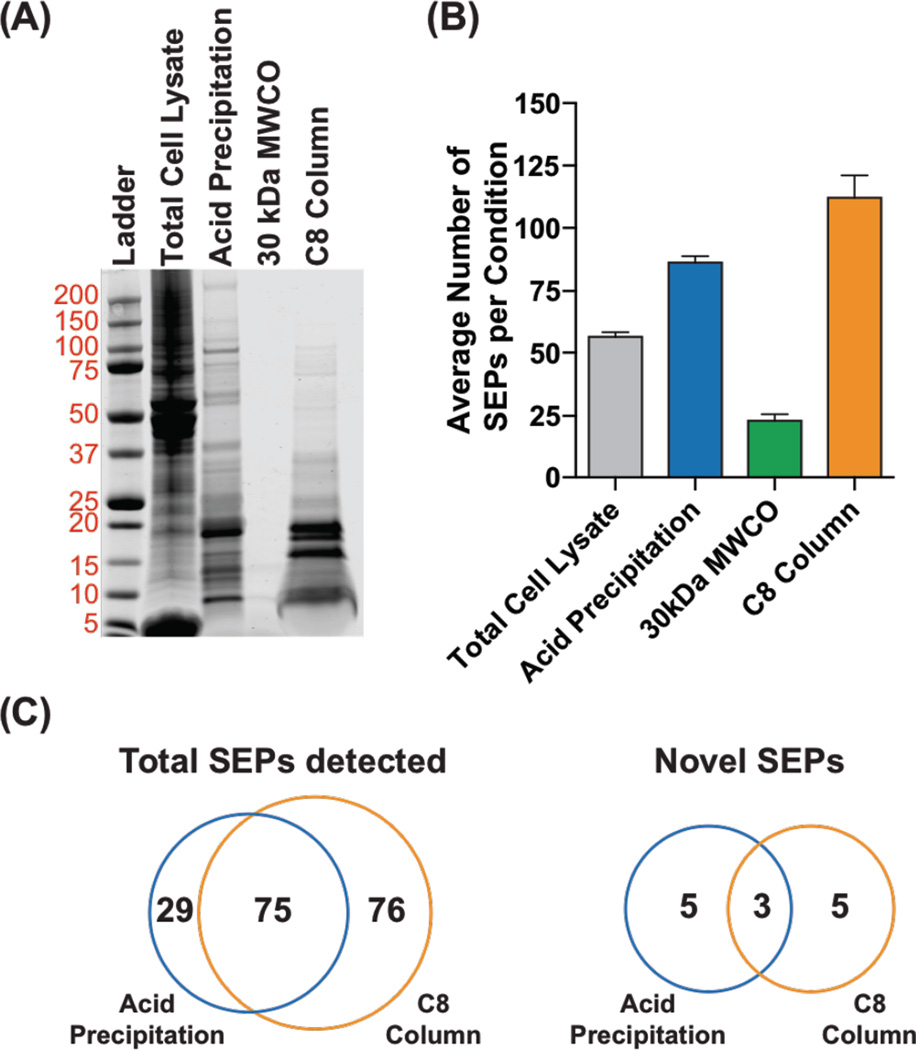
Figure 2.
Comparison of different methods for SEP enrichment using K562 cells. (A) Cells lysates were prepared by boiling in water followed by sonication. SEPs were enriched from this lysate by acid precipitation, a 30-kDa MWCO filter, or C8 SPE (i.e. C8 column). The results from these enrichments were analyzed by SDS-PAGE (30 µg total protein per lane, Coomassie stain). (B) Analysis of these samples by proteomics identified the average number of SEPs in each sample. (C) Venn diagrams of the total SEPs (known and novel) and novel SEPs in the acid precipitation and C8 column samples detected by proteomics.

