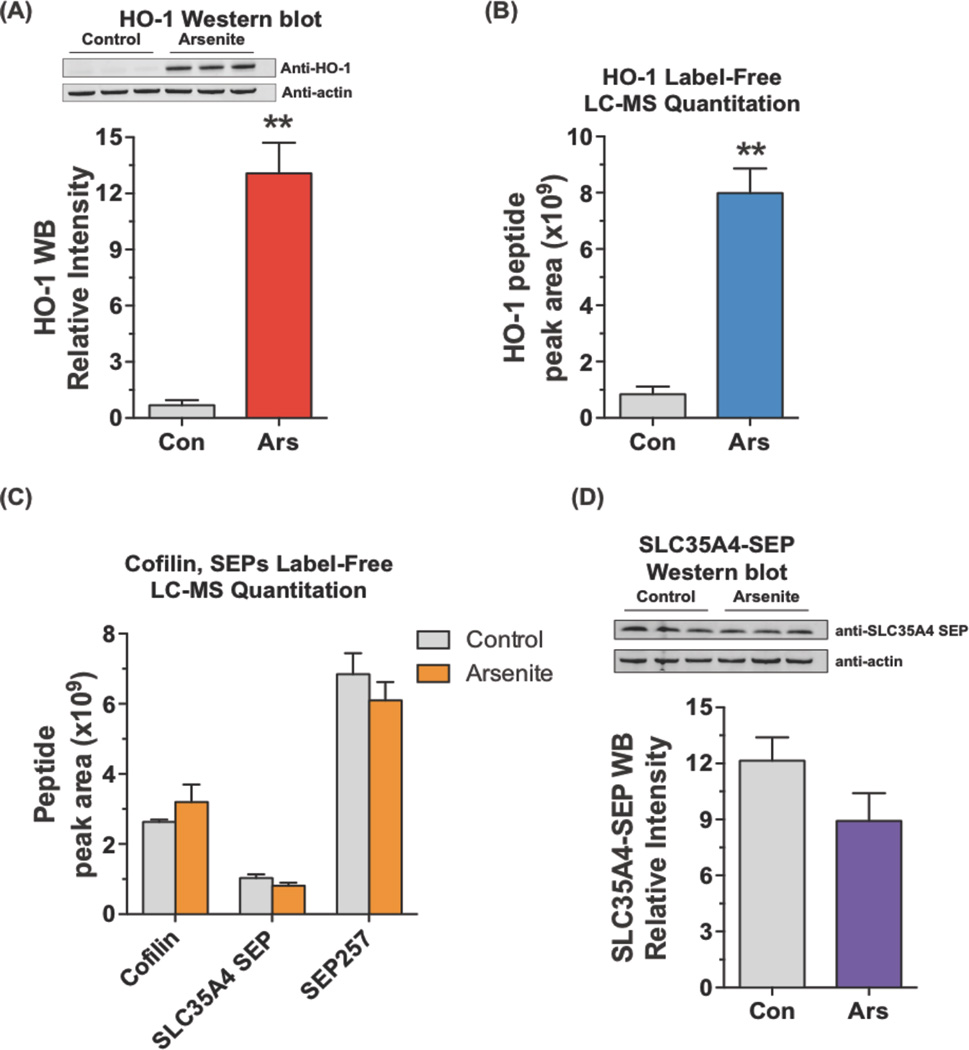
Figure 5.
Quantitation of SEPs upon arsenite treatment. (A) HEK293 cells were treated with 10 µM sodium arsenite for 24 hours. Western blot analysis revealed increased HO-1 expression upon on arsenite treatment (10 µM, 24 hours). The intensity of the bands on the Western blot was quantified by LiCor Odyssey CLx and normalized by beta-actin. (B) Peak area (MS1) of the HO-1 peptide agrees with Western blot. (C) Peak areas (MS1) of cofilin, SLC35A4-SEP, and SEP257 were unchanged upon arsenite treatment. (D) SLC35A4-SEP levels were also measured by Western blot, which agreed with the proteomics quantitation. The intensity of the bands on the blot was quantified by LiCor Odyssey CLx and normalized by beta-actin. (Student’s t-test, **, p < 0.01)

