
Fig. 6.
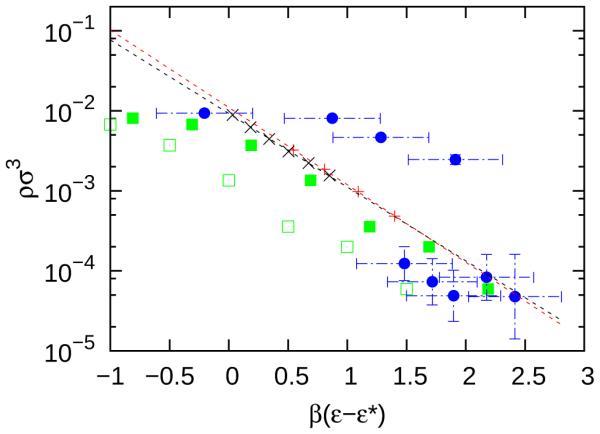
The concentration of free trimers (i.e., the CMC), shifted by ε∗, for model A simulations and previously published experimental data. 15 From this work A50, (red +) and A128, (black x) models are shown. The red and black dashed lines are the linear fits to the CMC for A50 and A128, respectively. In addition, simulations (green open squares) and experiments (blue circles) are shown from Wolters et al. 15 with . Finally, the shifted simulation results of Wolters et al. with are shown as green solid squares.