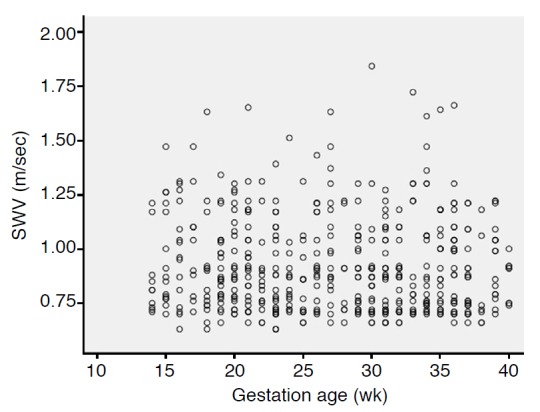
Fig. 2. Scatter plot of measurements of shear wave velocity (SWV) and gestational age at examination.

The distribution of measurements of SWV is almost even at different gestational ages at examination.

The distribution of measurements of SWV is almost even at different gestational ages at examination.