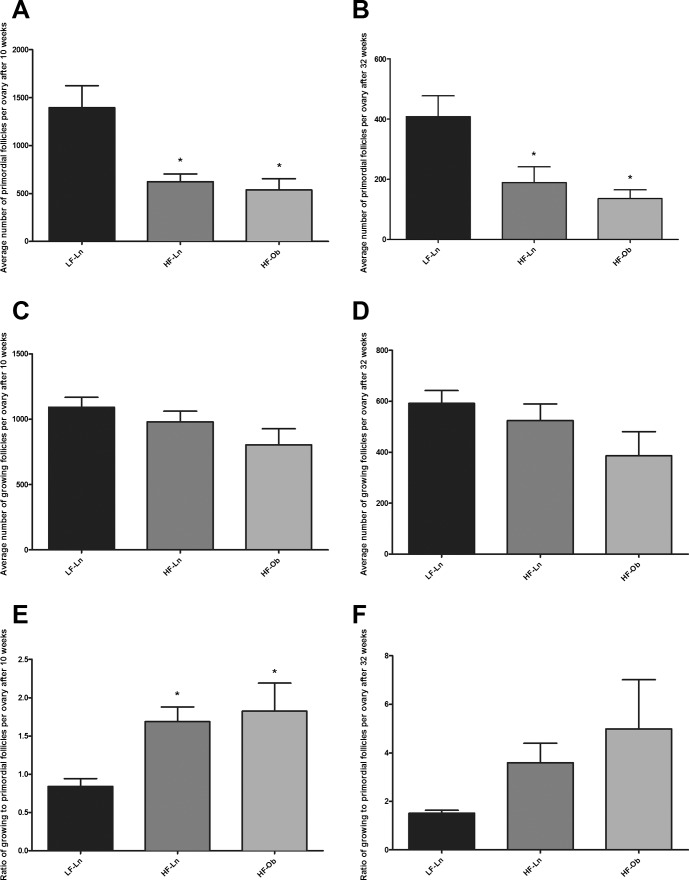
FIG. 3.
Primordial and growing follicle numbers per ovary. Follicle numbers were assessed after 10 and 32 wk on respective diets. Graphs represent the number of primordial (A and B) and growing (C and D) follicles per ovary in different dietary intervention groups at two time points. Graphs E and F represent ratio of growing to primordial follicles per ovary after 10 and 32 wk on diet. Bars represent mean ± SEM (n = 6 mice per group; one ovary per mouse); *statistically significant differences from LF-Ln group; P < 0.05. All data were analyzed by one-way ANOVA with Bonferroni correction for multiple comparisons.

