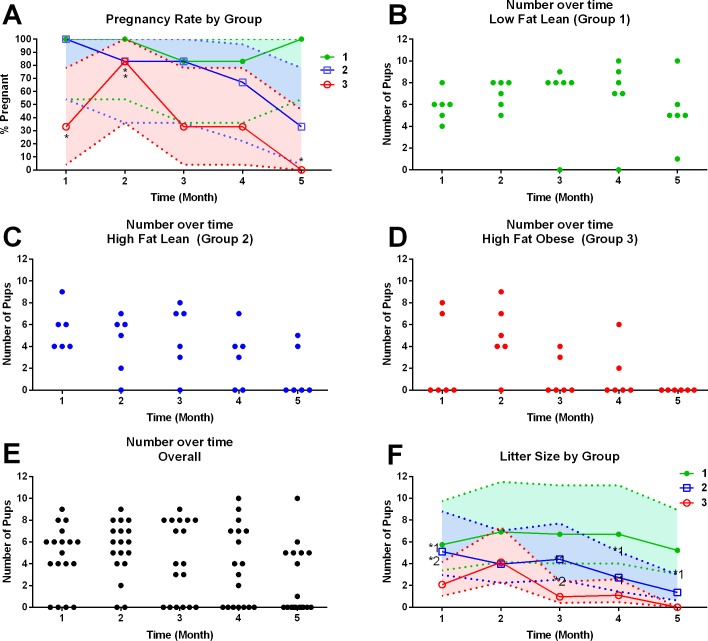
FIG. 5.
A) Average pregnancy rate by group over time. B–D) Number of pups over time per mouse per each group: LF-Ln (n = 6; B), HF-Ln (n = 6; C), HF-Ob (n = 6; D). E) Combined number of pups per litter over time. F) Average number of pups per litter over time. HFD is detrimental to pregnancy rate and to litter production rate over time regardless of obese phenotype. A) Asterisks indicate statistically significant differences from LF-Ln group. Colored areas around the lines indicate exact 95% confidence intervals for each proportion. F) Asterisks indicate statistically significant differences (1 = different from LF-Ln; 2 = different from HF-Ln). Colored areas indicate error bars.

