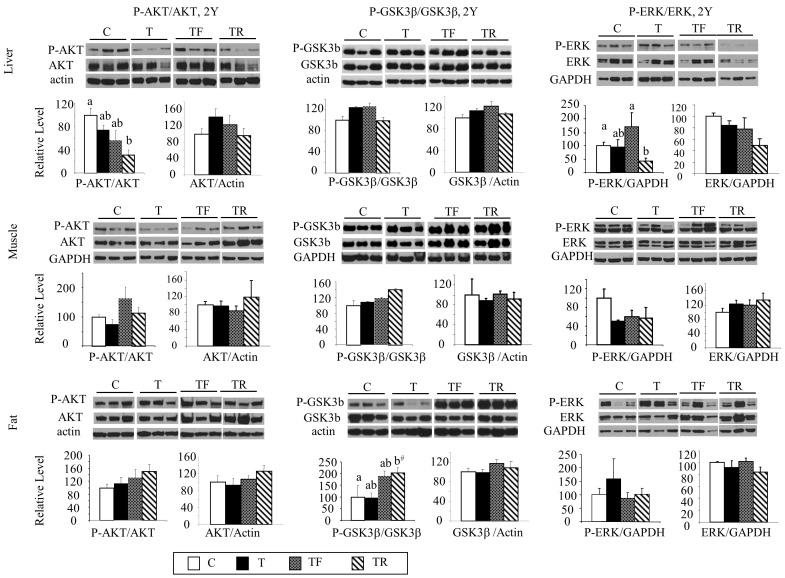
FIG. 4.
Changes in expression levels of total and phosphorylated AKT, GSK3β, and ERK in the liver (top row), muscle (middle row), and adipose tissue (bottom row) in 21-mo-old sheep. Representative Western blots (n = 3/group) are shown along with mean ± SEM of the p-AKT/AKT, AKT/GAPDH (left column), p- GSK3β/GSK3β, GSK3β/GAPDH (middle column), p-ERK/ERK, and ERK/GAPDH ratios (right column). C, control; T, prenatal T; TF, prenatal T plus flutamide; and TR, prenatal T plus rosiglitazone. Different superscripts indicate statistical significant changes; b#: P = 0.07, C versus T. Note statistical outcomes of analyses of AKT expression in the muscle before and after addition of the second cohort are similar (composite shown).

