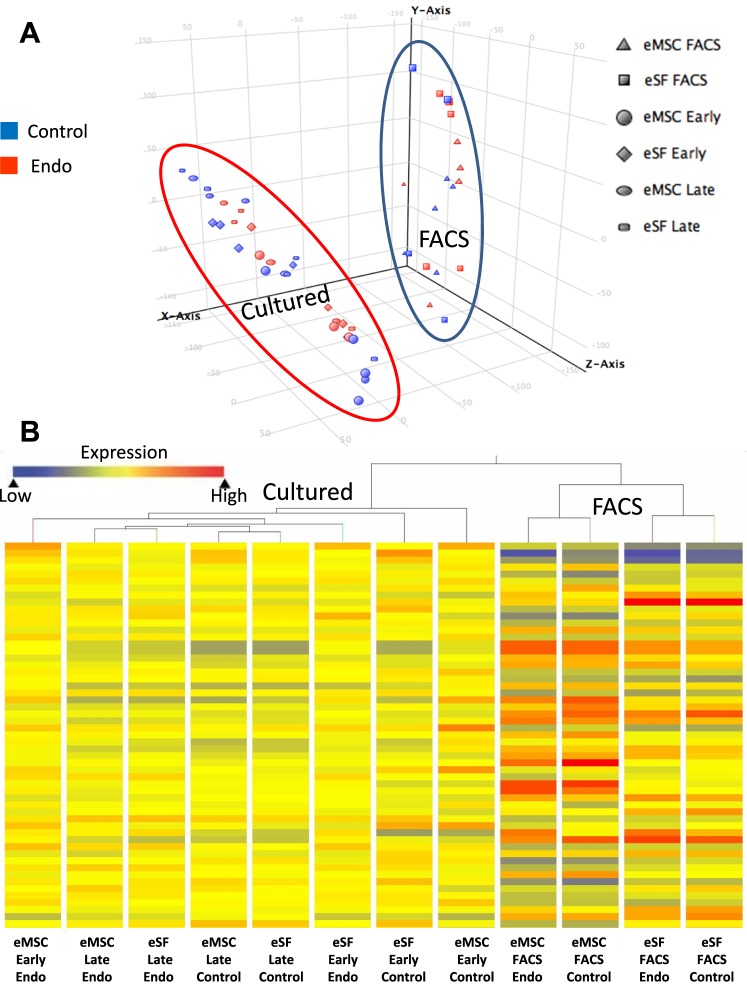
FIG. 2.
Clustering analyses. A) Principal component analysis (PCA) plot shows distribution of individual samples within the three-dimensional space defined by the three principal components accounting for the highest variances among probeset intensity values. In this two-dimensional representation of a three-dimensional image, the size of a symbol provides the perspective view of depth for its position, with smaller size symbols being closer to the origin and vice versa. The perspective shows two major clusters, one encircled by a blue line consisting of eMSC (triangles) and eSF (squares) analyzed immediately after FACS isolation; another cluster encircled by a red line corresponding to all cultured cells, including early eMSC (circles), early eSF (diamonds), late eMSC (ovals), and late eSF (rectangles), with blue symbols corresponding to control and red symbols to endo samples. Further subclustering by cell type is not clearly discernible in this particular perspective, but can be appreciated in a different orientation of the plot within the FACS cluster (not shown). B) Hierarchical clustering (HC) dendrogram, showing heat map bars representing average expression values in each experimental group indicated by the color spectrum shown from blue (low expression) to red (high expression). First branching segregates freshly FACS-isolated cells (right branch) and cultured cells (left branch), with further subbranching of FACS-isolated cells according to cell type (eMSC, eSF) and then by disease category (endo, control). Subbranching within cultured cells segregates successively first eMSC early control and second eSF early control from other groups, then the third and fourth branches separate eMSC early endo and eSF early endo, respectively, from all late cultures that cluster singularly first by disease (endo, control) and then by cell lineage (eMSC, eSF). Control, no endometriosis; Endo, endometriosis.

