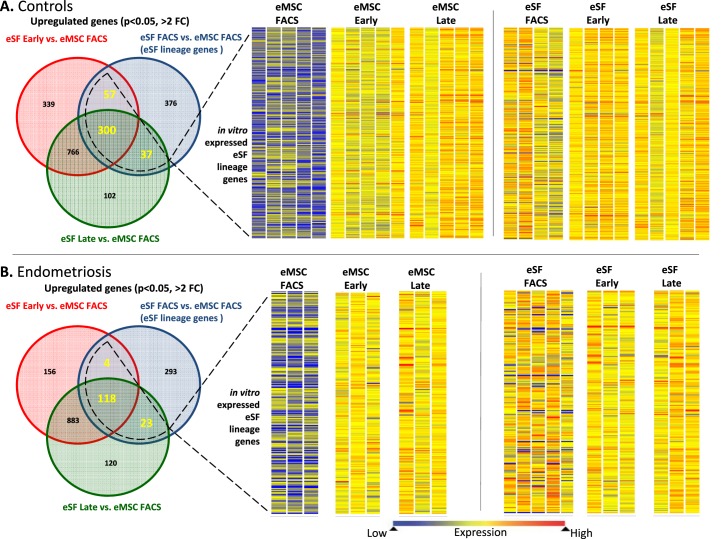
FIG. 4.
Expression of eSF lineage-associated genes in FACS-isolated and cultured eMSC and eSF. A) Controls. B) Endometriosis. Left panels show corresponding Venn diagrams of up-regulated genes (P < 0.05, >2-fold change) in eSF versus eMSC immediately after FACS isolation (eSF FACS vs. eMSC FACS, blue circles) representing eSF lineage genes in vivo and in eSF early (red circles) and eSF late (green circles) cultures versus eMSC FACS. Overlapping parts of the circles represent common up-regulated genes among the respective groups, with the corresponding number of common genes highlighted. The overall number of eSF lineage genes expressed in cultured eSF (surrounded by dotted line) represents the in vitro expressed eSF lineage genes whose expression levels in eMSC and eSF are shown as heat maps in the center and right panels, respectively. Heat map bars represent expression of in vitro expressed eSF lineage genes in individual samples from eMSC (center panel) or eSF (right panel) immediately after FACS isolation (eMSC FACS, eSF FACS) or from early (eMSC early, eSF early) or late (eMSC late, eSF late) cultures. Expression values are indicated by the color spectrum shown from blue (low expression) to red (high expression). Data shown in both controls (A) and endometriosis (B) eSF lineage gene expression by eMSC is low in freshly FACS-isolated cells (eMSC FACS) but increases in early (eMSC early) and late (eMSC late) cultures, while in eSF, the expression levels of freshly FACS-isolated cells (eSF FACS) are maintained in early (eSF early) and late (eSF late) cultures. Uneven numbers of samples per group in the eSF datasets (right panels) are the result of sample dropout due to failed quality control at either prehybridization (low/poor quality RNA amplification) or posthybridization (array quality control) or missing samples due to insufficient FACS yields for setting up primary cultures after allocating for analysis of freshly isolated cells.

