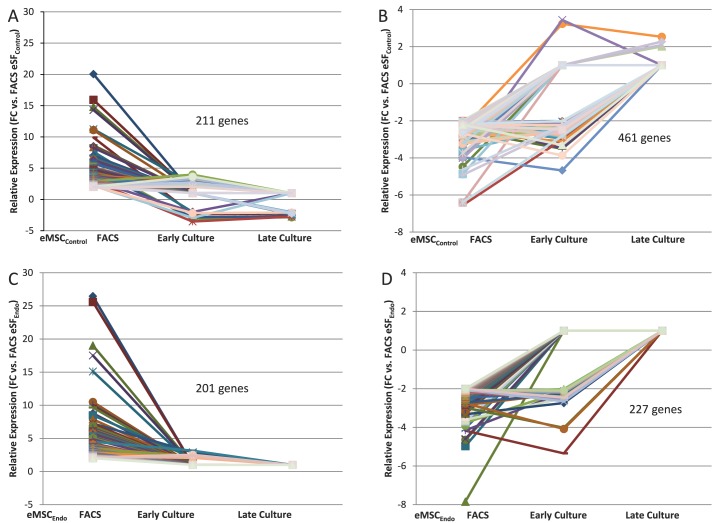
FIG. 5.
Expression of eMSC and eSF lineage-associated genes in FACS-isolated and cultured eMSC. Data correspond to differential expression analysis of the entire dataset consisting of n = 48 samples. Symbols/colors do not represent the same genes in different plots. Values represent the average relative expression (P < 0.05, >2-fold change) compared to freshly FACS-isolated eSF (eSF FACS) for each gene in the individual groups of eMSC from controls (A, B) or endometriosis (C, D): freshly FACS-isolated (eMSC FACS), early culture, and late culture. Genes up-regulated in eMSC FACS versus eSF FACS (A: control, 211 genes; C: endometriosis, 201 genes) correspond to in vivo eMSC lineage genes and are down-regulated in eMSC early and late cultures. Genes down-regulated in eMSC FACS versus eSF FACS (B: control, 461 genes; D: endometriosis, 227 genes) correspond to in vivo eSF lineage genes and are up-regulated in eMSC early and late cultures.

