Figure 7.
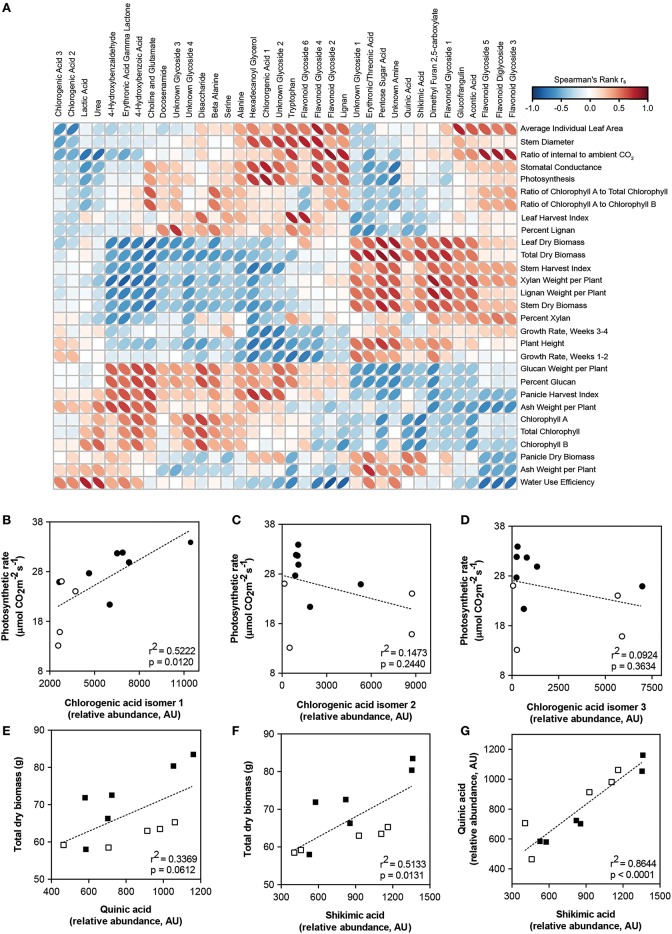
Correlation of metabolites with morphological and physiological traits. (A) Heat map with hierarchical clustering of 36 metabolites associated with morphology or physiology in sorghum. Color and ellipse eccentricity denote Spearman's rank correlation rs between metabolites and traits. Correlations with an r > |0.602| are significant (p < 0.05). Numerical values, including rs and p-values, are given in Additional file 4. (B–D) Scatterplots of mean relative abundance for three chlorogenic acid isomers plotted against mean photosynthetic rate for each sorghum line. (E,F) Scatterplots of mean abundance for shikimic and quinic acid plotted against mean total biomass for each sorghum line. (G) Scatterplot of mean abundance for shikimic acid plotted against mean abundance for quinic acid for each sorghum line. Closed circles, low biomass sorghum lines; open circles, high biomass sorghum lines; closed squares, low photosynthesis sorghum lines; open squares, high photosynthesis sorghum lines. Dashed lines indicate best fit line for linear regression performed on metabolite-trait relationships.

