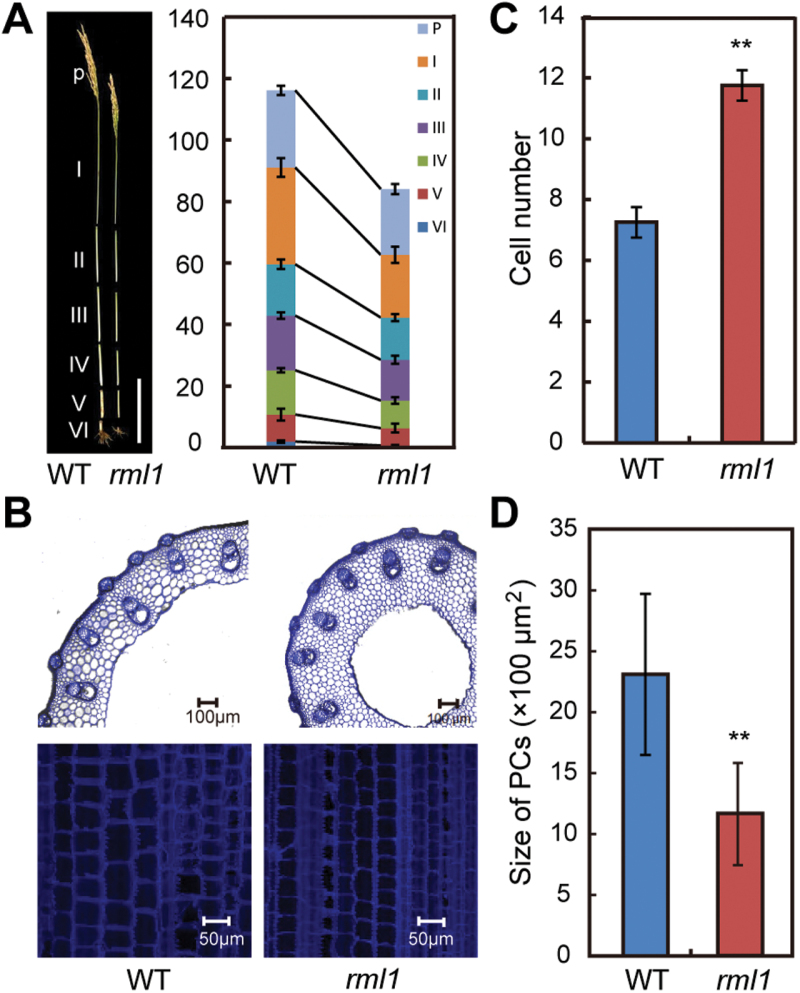
Fig. 3.
Morphological comparison of wild-type and rml1 plant height. (A) Phenotypic characterization of internodes of wild-type and rml1 plants at maturity. P, panicle. I to VI indicate corresponding internodes from top to bottom. (B) Transverse (top) and longitudinal (bottom) sections of the first internode (I) of wild-type and rml1 plants at maturity. (C) Comparison of parenchyma cell numbers in the transverse sections of the first internode of wild-type and rml1 plants. (D) Comparison of parenchyma cell (PC) size in longitudinal sections of the first internode of wild-type and rml1 plants. Student’s t-test was used for statistical analysis (*, P<0.05; **, P<0.01). Scale bar in (A) is 20cm.

