
Figure 1. Upregulated FANCD2 protects replication forks in BRCA2-deficient tumor cells.
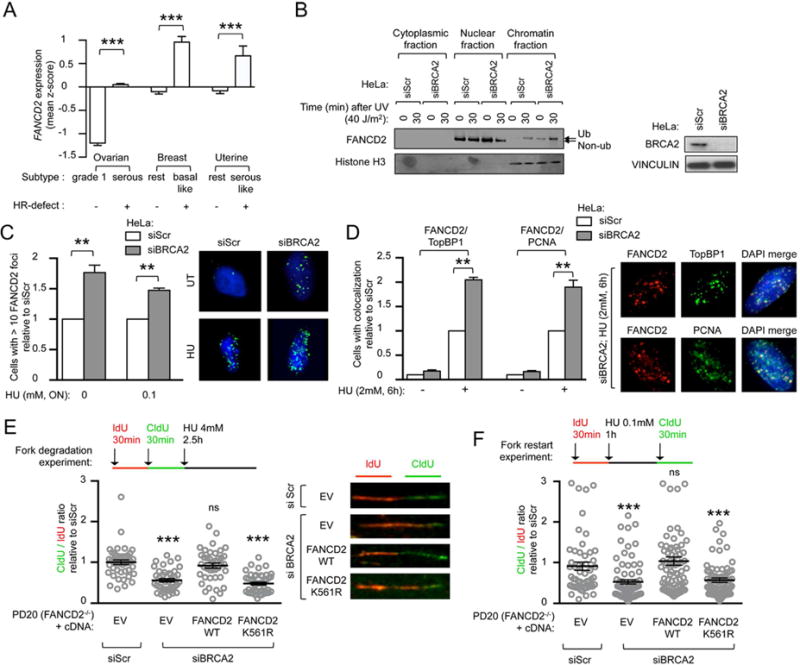
(A) FANCD2 gene expression in subtypes of ovarian, breast and uterine cancers. For each tumor group, expression values are represented as the mean of z-scores. (B) FANCD2 immunoblot in HeLa cells after siRNA depletion of BRCA2, at indicated time points after UV treatment and cellular fractionation. Immunoblot showing BRCA2 depletion efficiency. (C) Quantification of baseline and damage (HU)-induced FANCD2 foci in HeLa cells after siRNA depletion of BRCA2. Representative images are shown. Satistics were performed on n≥150 cells per condition and expressed as relative to siScr that was conventionally set to 1. (D) Baseline and damage (HU)-induced FANCD2, TopBP1 and PCNA immunofluorescence in HeLa cells after siRNA depletion of BRCA2. Representative images are shown. Representative images are shown. Satistics were performed on n≥150 cells per condition and expressed as relative to siScr that was conventionally set to 1. (E, F) Schematic for the labeling of FANCD2-deficient (PD20) cells with ldU and CIdU for fork degradation (E) and for fork restart experiments (F). Scatter dot plot for CIdU to ldU ratio of cells expressing indicated cDNA and transfected with indicated siRNA. Satistics were performed on n≥100 fibers per condition and expressed as relative to EV, that was conventionally set to 1. Representative images are shown. Data in C–F represent mean ± s.e.m. over n=3 independent experiments. Data in A, C–F were analyzed using Student’s t test. Abbreviations: ON, over-night; ns, non significant; EV, empty vector; WT, wild-type.