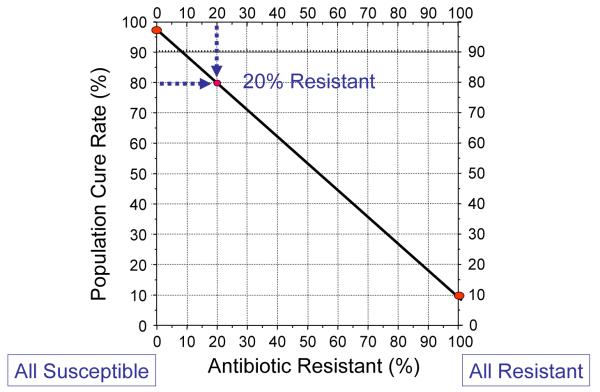
Figure 2.
H. pylori nomogram. This nomogram plots the cure rate with susceptible infections on the left vertical axis and those with resistant infections on the right vertical axis. The proportion with resistance is shown on the horizontal axis [43]. The cure rates with 100% susceptible and 100% clarithromycin resistant are connected with a line allowing one to visualize the population cure rates for any prevalence of resistance. This plot shows the cure rates with a 14 day PPI, clarithromycin, amoxicillin triple therapy in a western population in relation to the prevalence of clarithromycin resistance. It also illustrates the expected cure rate, per protocol, expected with a prevalence of clarithromycin resistance of 20%.

