
Figure 2.
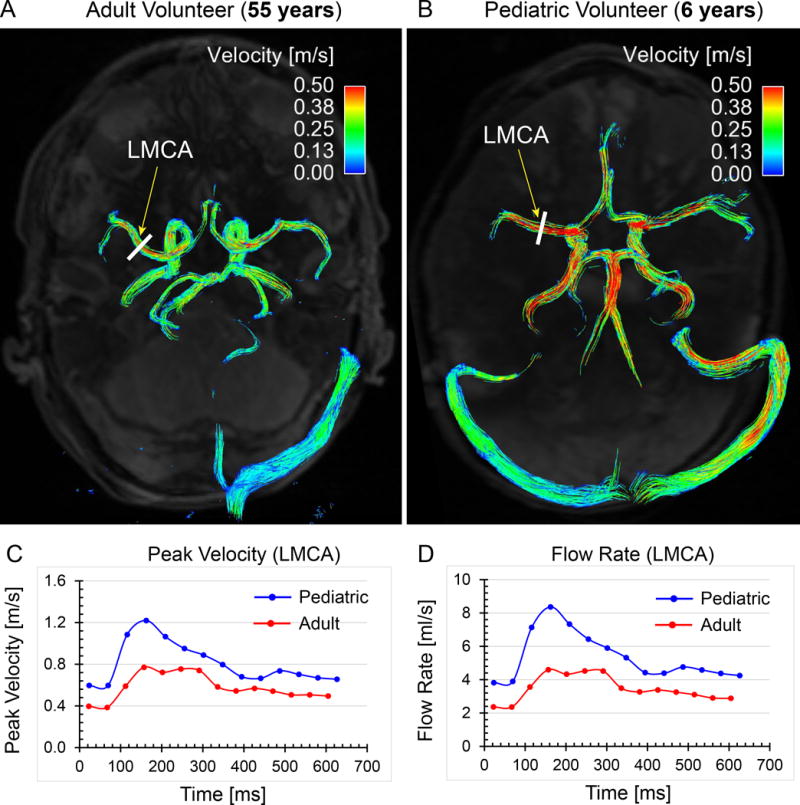
Comparisons of normal cerebral blood flow between a healthy adult volunteer (55 years) and a pediatric volunteer (6 years). Time-integrated 3D pathlines show overall higher cerebral blood flow velocities in the pediatric volunteer (B) compared to the adult volunteer (A). Regional flow measurements at the left middle cerebral artery (LMCA) quantitatively illustrate the differences of LMCA peak velocity (C) and flow rate (D) between the adult and pediatric volunteers.