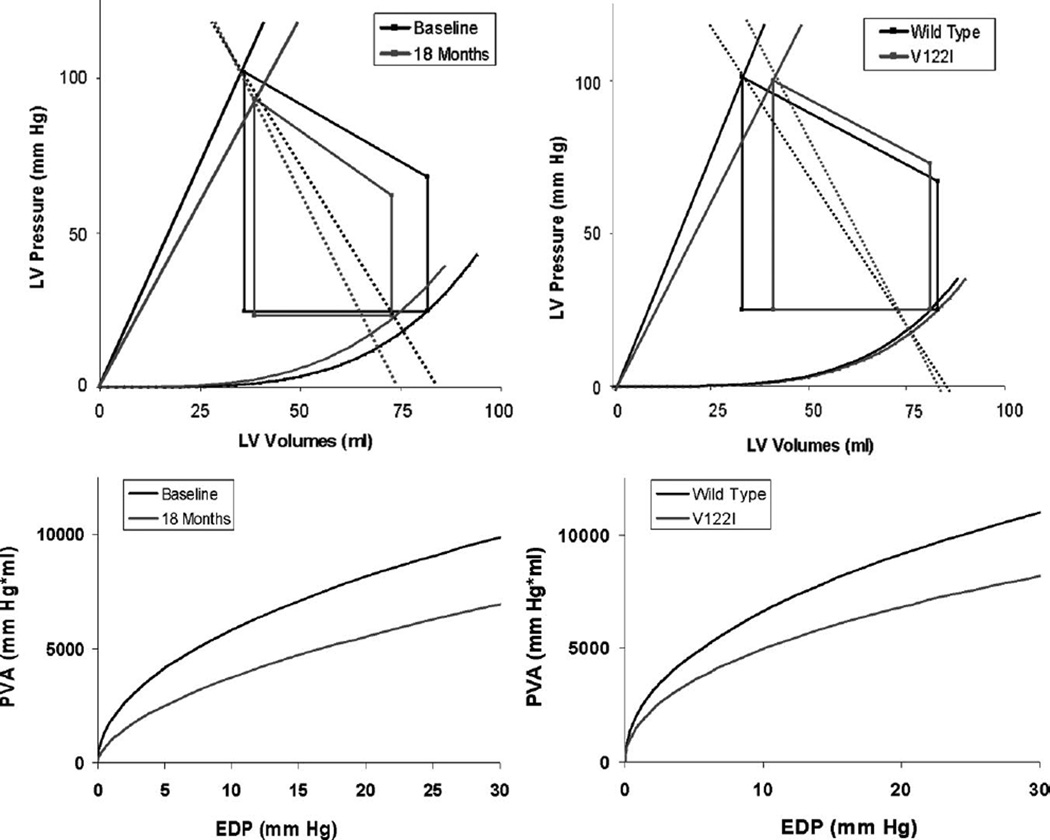
Figure 2.
Pressure-volume relations (top) and isovolumetric pressure-volume area (PVA-iso, bottom). Baseline to 18-month follow-up (left) and V122I versus wild-type at baseline (right). There were significant (eg, P < 0.05) increases in Ea, declines in Res, and altered Ea/Res ratio from baseline to 18 months (left) and differences in baseline in Ea and Ea/Res ratio between wild-type and V122I (right). In addition, significant differences in PVA-iso curves were noted for both comparisons. See text for details.

