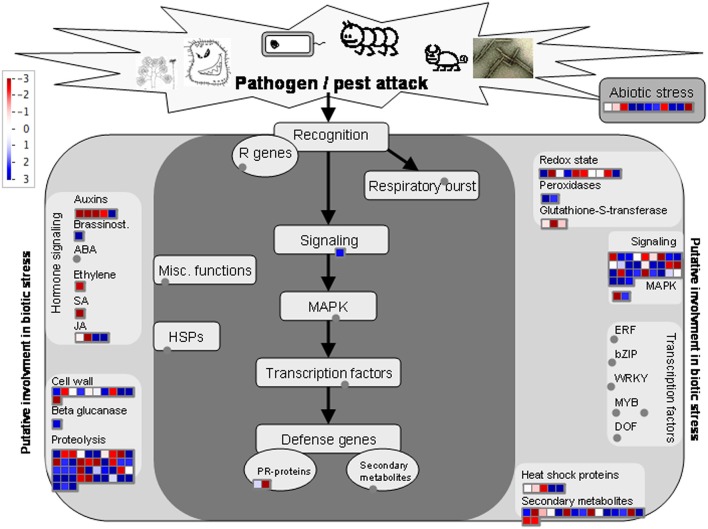
Figure 2.
Annotation of 145 DAPs in relation to signaling pathways involved in biotic/abiotic stress responses based on the analysis using the software Mapman. The blue and red colors indicate up- and down-regulation, respectively, and gray circles indicate no DAPs identified in these categories. The annotation information is summarized in Table S4 (Supporting Information).

