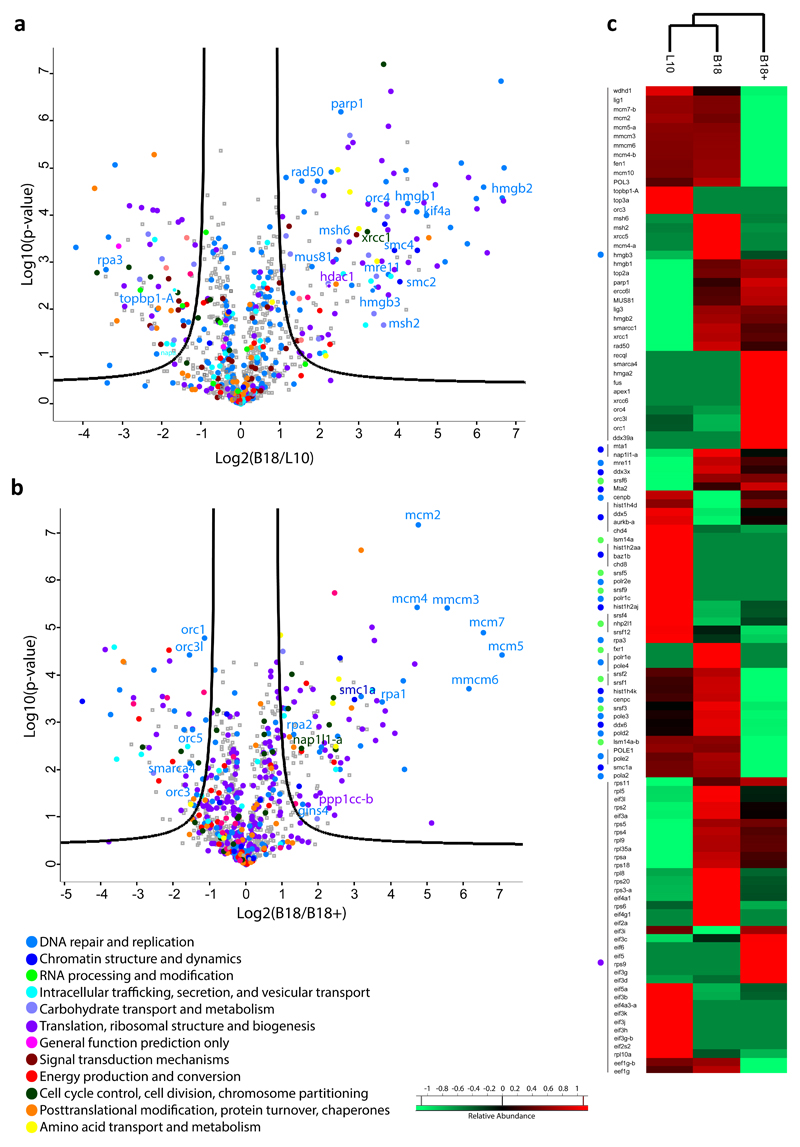
Figure 2. Proteomic analysis of replicating centromeric and non-cetromeric chromatin using label free quantitative MS.
(a) Centromeric B18 and non-centromeric L10 chromatin was isolated after 150 minutes incubation of BAC DNA in egg extract and analysed by high resolution MS-MS. Volcano plots show the mean log2 protein B18/L10 ratio plotted against the p-values of biological replicates. Proteins differentially represented on centromeric and non-centromeric chromatin are shown. Black lines indicate the significance cut off. (b) Proteins differentially represented on centromeric chromatin in the absence (B18) or in the presence (B18+) of geminin analysed as in (a) are shown. Experiments shown in (a) and (b) were repeated with three different extracts (see Methods and Table S2 for statistical significance). (c) Heat map for some non-centromeric (L10) and centromeric (B18) or geminin sensitive (B18+) proteins. Chromatin enriched proteins are in red, depleted proteins in green.

