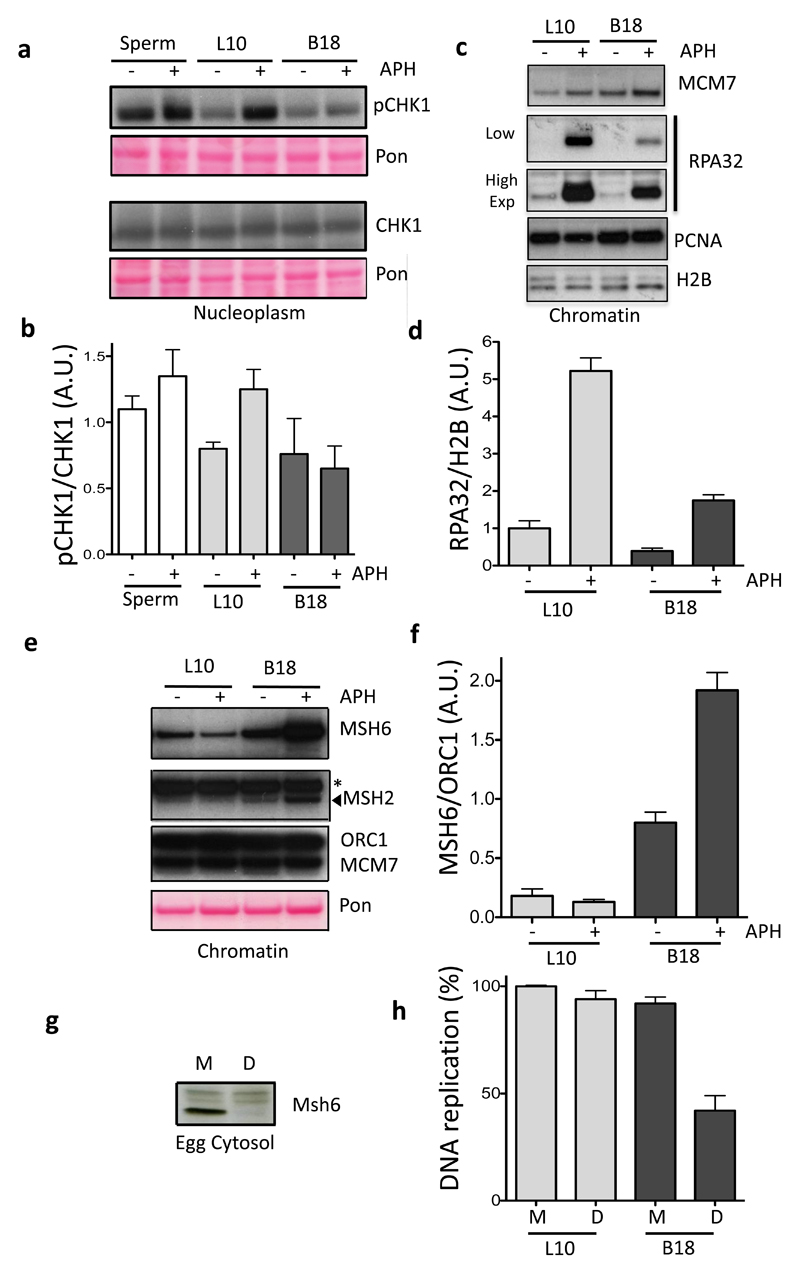
Figure 3. Centromeric DNA Replication is associated with checkpoint suppression and MMR proteins accumulation.
(a) Sperm nuclei, L10 or B18 BACs were incubated in egg extract treated with 25 μg ml-1 aphidicolin (APH) (+) or buffer (-). Cytoplasmic CHK1 and its phosphorylated form (pCHK1) were detected using specific antibodies as indicated. Total transferred proteins were stained with Ponceau (Pon). (b) The average ratio of pCHK1 signal over the total level of CHK1 was quantified and plotted in the graph. Error bars represent ± sd of the mean. n=5 independent experiments; p<0.05 when comparing Sperm, L10 and B18 mean values for APH (+) or buffer (-) treated conditions; One-way Anova. (c) Chromatin from L10 and B18 BACs was isolated after 150 minutes of incubation in extracts supplemented with APH (+) or buffer (-). Samples were analysed by WB using antibodies against the indicated proteins. (d) Average ratio of RPA32 over Histone H2B (H2B) signal was quantified and shown in the graph. Error bars represent ± sd of the mean. n=7 independent experiments; p<0.01 when comparing L10 and B18 mean values for APH (+) or buffer (-) treated conditions; One-way Anova. (e) Chromatin from L10 and B18 BACs treated as in (c) was analysed by WB with the indicated antibodies. Total transferred proteins were stained with Ponceau (Pon). Asterisk indicates non-specific band. (f) Average ratio of MSH6 over ORC1 bound to chromatin was quantified and shown in the graph. Error bars represent ± sd of the mean. n=3 independent experiments; p<0.05 when comparing L10 and B18 mean values for APH (+) or buffer (-) treated conditions; One-way Anova. (g) WB of egg cytosol that was mock (M) or MSH6 depleted (D) using anti Xenopus MSH6 antibodies. A typical result is shown. (h) L10 and B18 DNA replication in mock (M) and MSH6 depleted (D) extracts. Relative average percentage of 32PdCTP incorporation is shown. L10 values in mock-depleted extracts were considered 100%. Error bars represent ± sd of the mean. n=3 experiments; p<0.05 when comparing L10 and B18 mean values for Mock (M) and MSH6 depleted extracts (D); One-way Anova.

