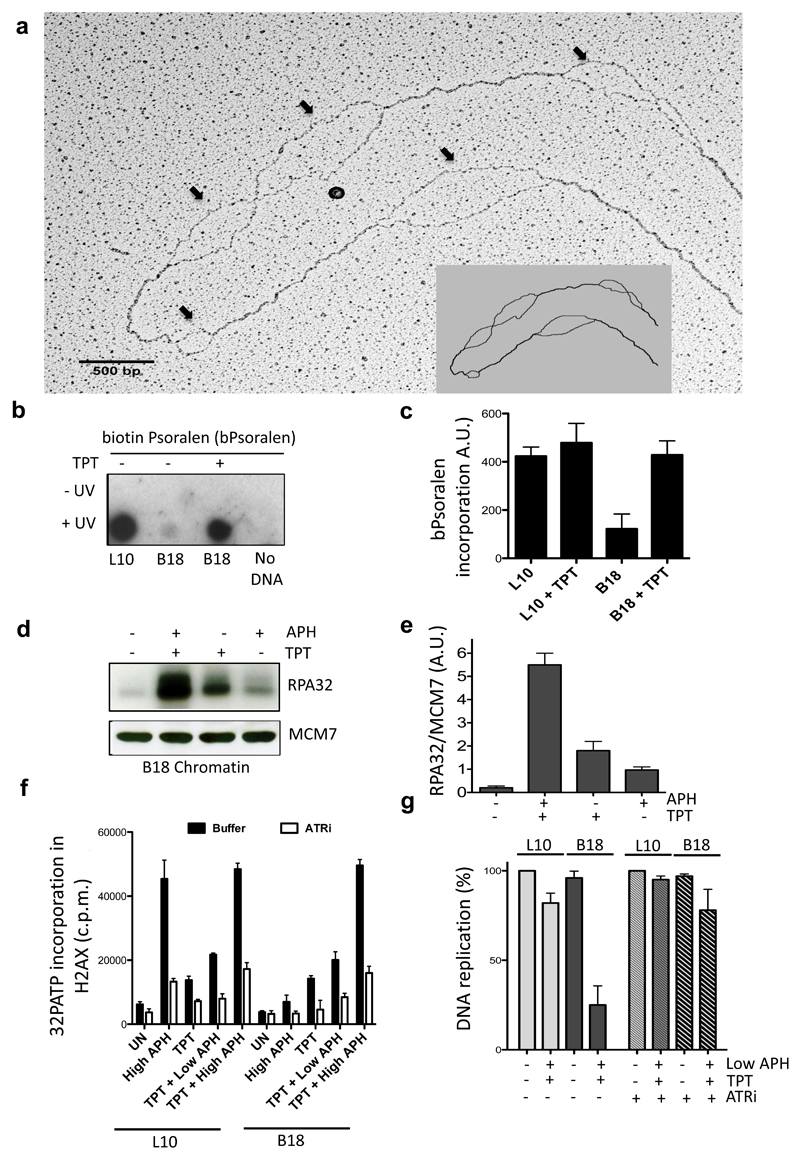
Figure 4. Overwound centromeric DNA suppresses RPA accumulation and ATR activation.
(a) EM of B18 DNA isolated after 150 minutes incubation in interphase extract. Arrows indicate ssDNA bubbles. Scheme is included. Data represent 1 out of 3 experiments. (b) Streptavidin-HRP stained dot blot of L10 ad B18 DNA isolated from BAC nuclei replicated with 40 μM topotecan (TPT) or left untreated and treated with biotin-psoralen (bPsoralen) in the presence (+) or absence (-) of UV. Data represent 1 out of 3 experiments (c) Total incorporated bPsoralen was measured using a fluorescence based biotin quantification assay. Values represent fluorescence intensity expressed in arbitrary units. Error bars represent ± sd of the mean. n=3 experiments; p<0.05 when comparing L10 and B18 mean values for all treatments; One-way Anova. (d) WB of RPA32 and MCM7 bound to B18 chromatin isolated from nuclei replicated in the presence of 40 μM topotecan (TPT) and 25 μg ml-1 APH as indicated. (e) RPA32/MCM7 ratio. Error bars represent ± sd of the mean. n=3 experiments; p<0.01 when comparing B18 mean values for all treatments; One-way Anova. (f) Average incorporation of 32P in histone H2AX C-terminal peptide in the presence of nucleoplasm derived from L10 and B18 nuclei replicated in extracts that were untreated (UN), treated with 25 μg ml-1 APH (High APH), 40 μM TPT, TPT and 1 μg ml-1 APH (TPT + Low APH) or TPT and 25 μg ml-1 APH (TPT + High APH). Reactions were performed in the absence (black bars) or in the presence (white bars) of 10 μM VE-821 (ATRi). Error bars represent ± sd of the mean. n=3 experiments; p<0.001 when comparing B18 and L10 mean values for all treatments; One-way Anova. (g) L10 and B18 DNA replication in extracts treated with 40 μM TPT and 1 μg ml-1 APH (Low APH) in the presence or absence of ATRi as indicated. Relative average percentage of 32PdCTP incorporation is shown. L10 values in untreated extracts were considered 100%. Error bars represent ± sd of the mean. n=3 experiments; p<0.001 when comparing B18 and L10 mean values for all treatments; One-way Anova.

