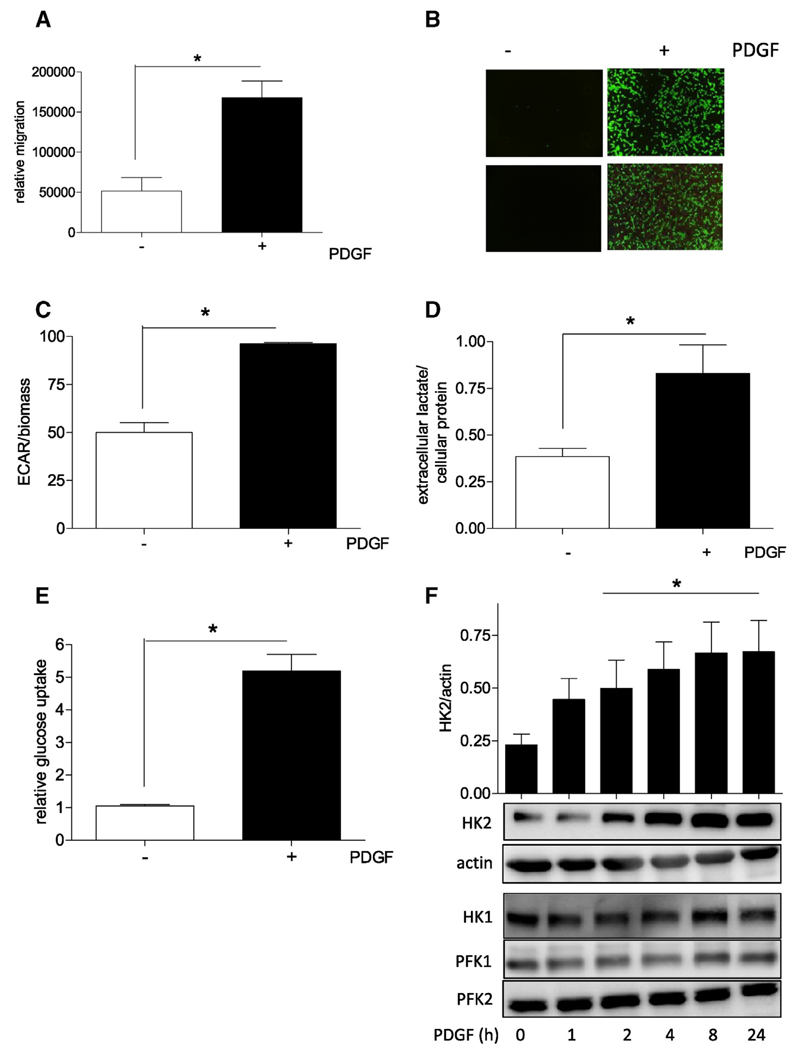
Fig. 1.
PDGF-triggered VSMC migration is accompanied by an increase in glycolytic activity, glucose uptake and hexokinase 2 expression. (A) Serum-deprived VSMCs were subjected to a wound healing (scratch) assay with or without stimulation with 10 ng/ml PDGF-BB for 21 h Graphs indicate relative values of wound closure as assessed by CellProfiler Software (n = 3, mean + SD.; * p < 0.05; Student's t-test). (B) Quiescent VSMC were subjected to a Boyden Chamber chemotaxis assay using 10 ng/mL PDGF (6 h) as chemotactic stimuli. Migrated cells were visualized by calcein-AM staining and photographed. Representative pictures of three independent biological replicates with consistent results are shown. (C) Glycolytic activity in quiescent and PDGF-stimulated (6 h) VSMC was determined by extracellular flux analysis as described. The bar graph depicts compiled data of three independent experiments (n = 3, mean + SD.; * p < 0.05; Student's t-test) (D) Extracellular lactate accumulation was determined after PDGF stimulation (10 ng/mL, 6 h) by an enzyme-based fluorescence assay and subsequent correction for protein concentration. Bar graph depicts compiled data of three independent experiments (n = 3, mean + SD.; * p < 0.05; Student's t-test) (E) Cellular glucose uptake rate in quiescent and PDGF-stimulated (10 ng/mL; 6 h) VSMC was determined in an isotope-based assay. Bar graph depicts compiled data of three independent experiments (n = 3, mean + SD.; * p < 0.05; Student’s t-test) (F) Quiescent VSMC were stimulated with PDGF (10 ng/mL) for the indicated periods of time before total cell extracts were subjected to western blot analyses for HK2, actin, HK1, PFK1 and 2. Bar graph depicts compiled densitometric data (HK2/actin) of three independent experiments (n = 3, mean + SD.; * p < 0.05; ANOVA, Dunnett vs unstimulated control).

