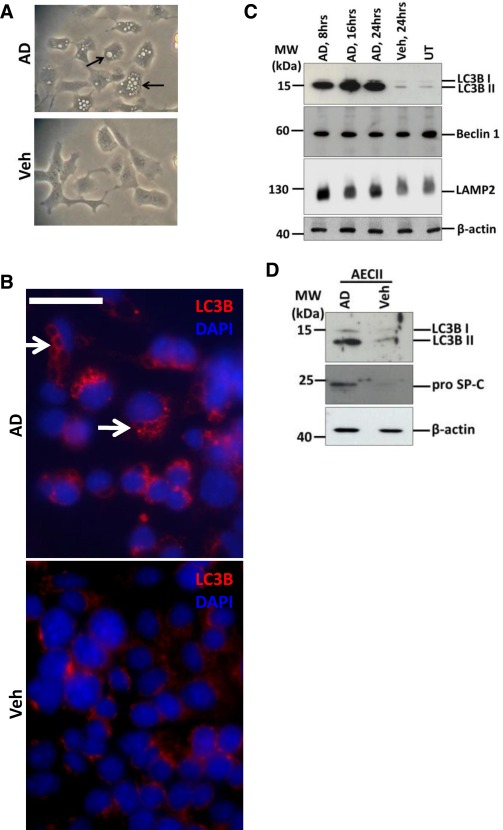
Figure 1.

Increase in markers of autophagy in alveolar epithelial cells following AD treatment. (A) Phase contrast images of MLE12 cells 8 h post AD or vehicle treatment. Arrows indicate huge vacuolar structures in AD‐treated MLE 12 cells. (B) Immunofluorescence images for LC3B (red) from MLE 12 cells treated with AD or vehicle for 8 h. Arrows indicate LC3B‐labelled vacuolar structures in AD‐treated cells. (C) Representative Western blot images from cell lysates from AD (8, 16, and 24 h) or vehicle treated (24 h) or untreated MLE12 cells for LC3B, Beclin1, LAMP2 and ß‐actin. (D) Immunoblot images for LC3B and pro SP‐C from AECIIs isolated from C57Bl/6 mice and treated for 24 h with AD or vehicle.
