Figure 2.

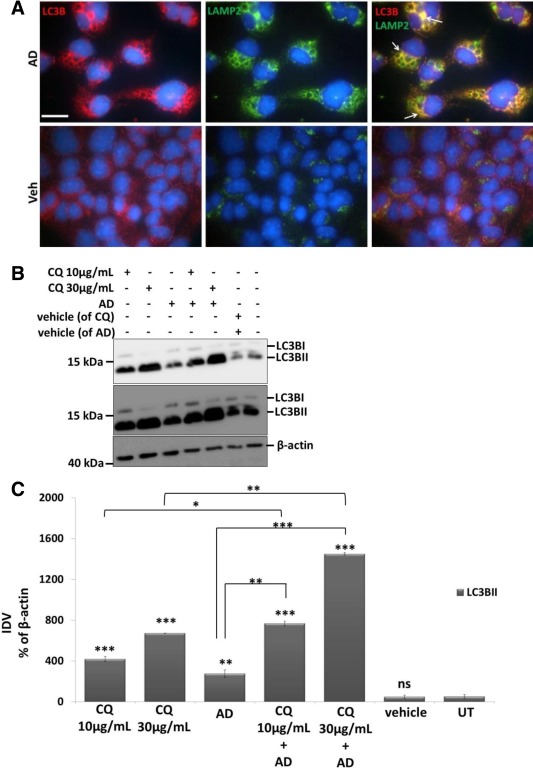
AD‐induced increased autophagy flux in MLE 12 cells. (A) Immunofluorescence images for LC3B (red), LAMP2 (green) and overlay images of both LC3B and LAMP2 from MLE 12 cells treated with AD or vehicle for 8 h. Arrows indicate huge vacuolar structures labelled with both LC3B and LAMP2 (yellow) in AD‐treated cells. Nuclei are stained with DAPI (blue). Scale bar = 50 µm. (B and C) Representative Western blot images for LC3B and β‐actin after pre‐incubation of MLE12 cells with chloroquine (CQ; 10 and 30 µg/ml) for 4 h followed by AD or vehicle treatment for 8 h. Upper and middle panels represent lower and higher exposures (to detect LC3BI), respectively, of the LC3B Western blot membrane and densitometry analysis performed from n = 3 independent experiments. Significance was calculated by comparing all treated groups with untreated cells and then between different treatment groups as indicated. *p < 0.05, **p < 0.01, ***p < 0.001.
