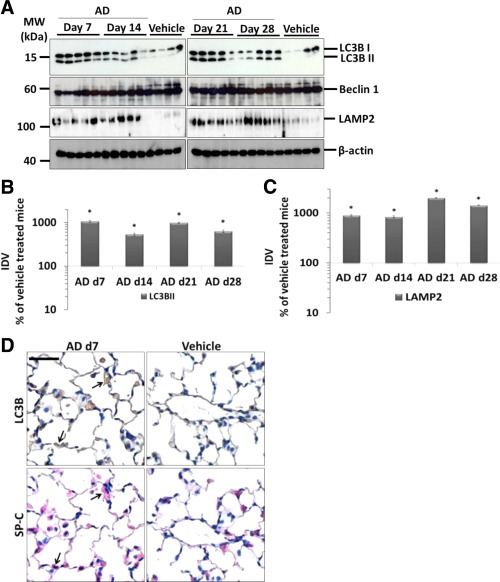
Figure 4.

Increase in markers of autophagy in AECIIs from AD‐treated mice. (A) Western blot analysis of lung homogenates of (left) AD‐treated mice at days 7, 14 and vehicle at day 28 and (right) AD‐treated mice at days 21, 28 and vehicle at day 28 for LC3BII, Beclin 1, LAMP2 and β‐actin. (B and C) Graphical representation of densitometry analysis is shown for the LC3B and LAMP2 Western blots shown in (A). Representative blots and analysis from n = 5 mice. *p < 0.05. (D) Representative images of immunohistochemistry for LC3B and pro SP‐C performed on serial lung sections from day 7 AD and vehicle‐treated mice. Arrows indicate AECIIs positive for LC3B. Scale bar = 50 μm; Original magnification of pictomicrographs: x400.
