
Figure 2. Identification of phospho-FAK (p-FAK, Y397) and BRAF as novel HSP70 ‘client’ proteins.
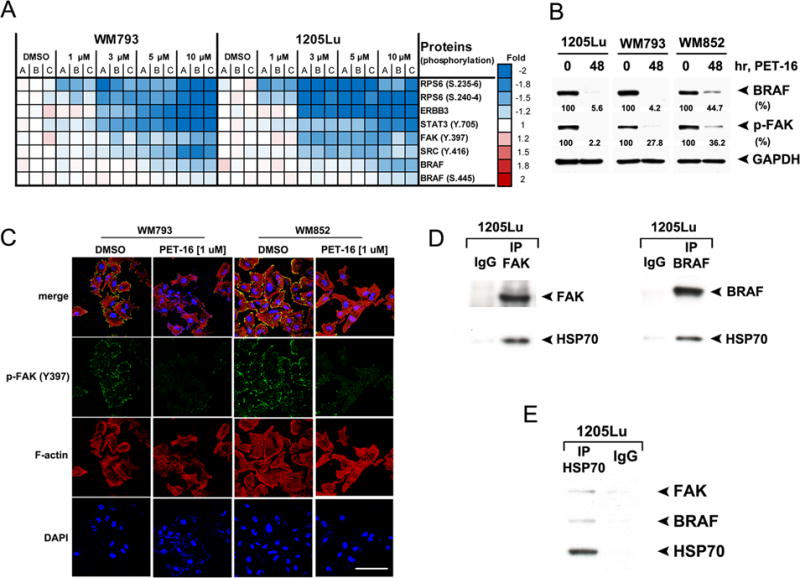
A. WM793 and 1205Lu cells (mutant BRAF) were treated with DMSO or with the indicated concentrations of PET-16 for 24 hours and then subjected to RPPA analysis. The heat map visualizes expression levels for melanoma-related proteins with significantly reduced expression following PET-16 treatment. A, B and C are individual samples from three independent experiments.
B. Melanoma cell lines 1205Lu, WM793 and WM852 were treated with DMSO or 20 μM PET-16 for 48 hours. Whole cell lysates were then subjected to immunoblot analysis for BRAF and p-FAK. GAPDH is included as a loading control. Densitometric quantification of BRAF and p-FAK levels is shown below.
C. Immunofluorescence analysis of WM793 and WM852 cells treated with DMSO or 1 μM PET-16 for 24 hours, immunostained with antisera to p-FAK (Y-397) followed by fluorescent secondary, along with fluorescent-labeled phalloidin (red) and DAPI (blue). Scale bar = 100 μm.
D. Immunoprecipitation with FAK antibody (left panel), BRAF antibody (right panel) or equal amount of IgG followed by western analysis for the level of associated HSP70 in 1205Lu cells.
E. Immunoprecipitation with HSP70 antibody or equal amount of IgG followed by western analysis for the level of associated FAK and BRAF in 1205Lu cells.