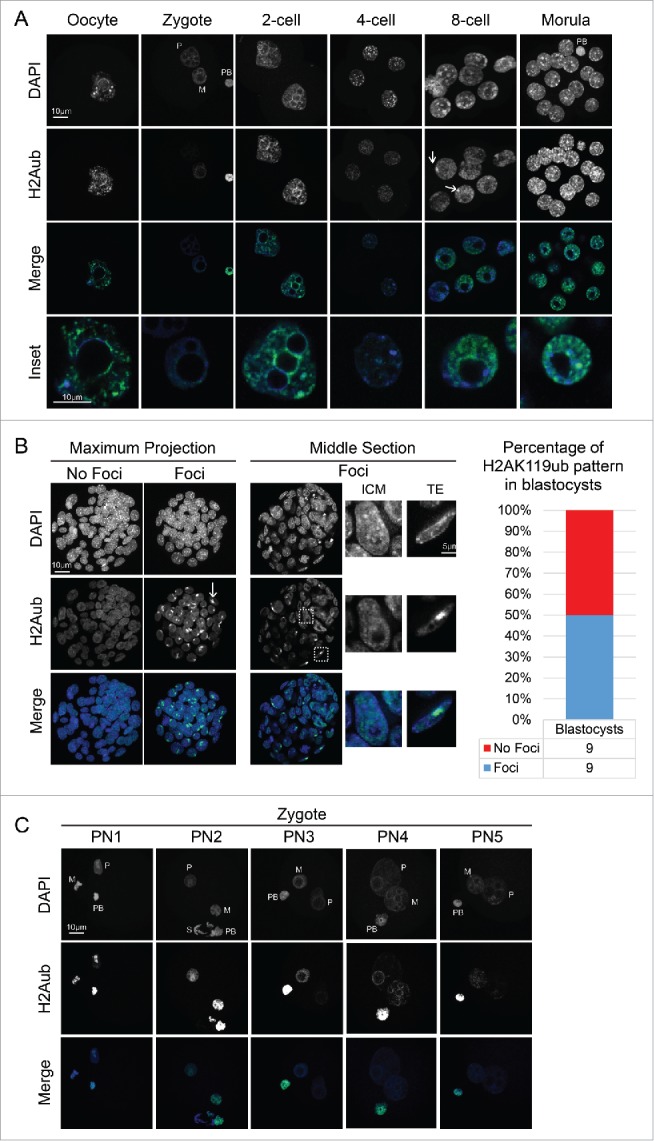
Figure 1.

Dynamic establishment of H2AK119ub during mouse pre-implantation development. (A) Representative images showing full Z-projections of confocal sections of oocytes and embryos from the zygote to the morula stage stained with DAPI and H2AK119ub antibodies. White arrows at the 8-cell stage indicate accumulation of H2AK119ub at foci. Bottom panels are merged images of single sections showing insets of nuclei from the embryos above at a higher magnification. (B) Representative images of full Z-projections of confocal sections of blastocysts stained with DAPI and H2AK119ub antibody. A representative projection of a blastocyst showing H2AK119ub accumulation in foci is shown with 2 insets depicting one inner cell mass (ICM) nucleus and a trophectoderm (TE) nucleus. On the right, the percentage of embryos showing or not H2AK119ub foci, n =18. (C) Full projection of confocal Z-sections of H2AK119ub and DAPI at 5 different pronuclear (PN) stages in the zygote. Abbreviations: M: maternal, P: paternal, PB: polar body, S: sperm. Scale bars correspond to 10 µm.
