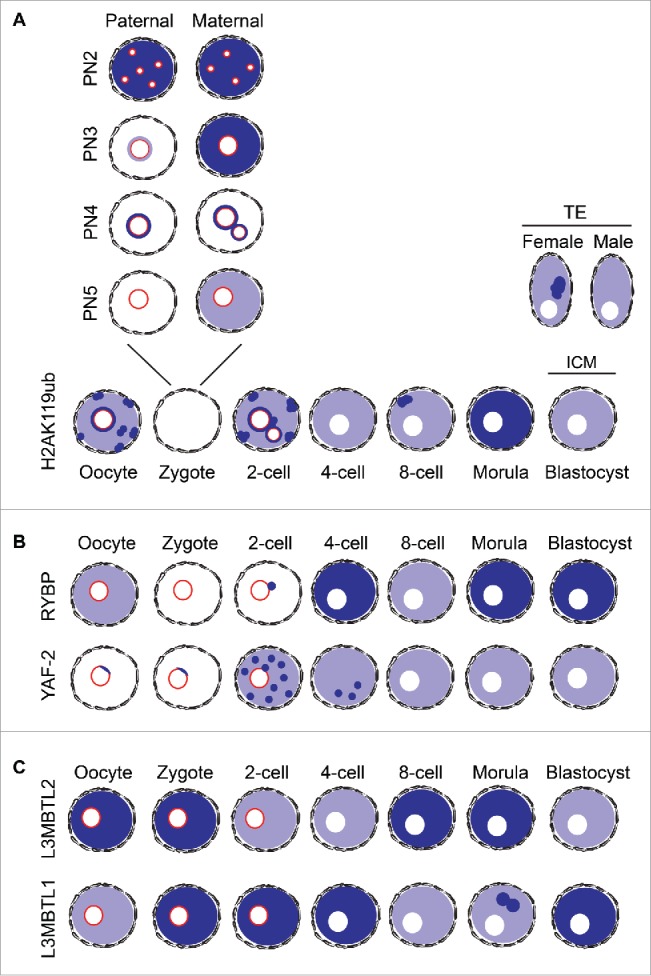
Figure 4.

Schematic representation of the distribution of H2AK119ub and the proteins studied across developmental stages. Nuclear pattern distribution of H2AK119ub (A), RYBP, YAF-2 (B), L3MBTL2 and L3MBTL1 (C) at all stages of pre-implantation development. Levels H2AK119ub (A) at the zygote stage are subdivided into 4 ProNuclear (PN) stages to reflect dynamic changes in the pattern and levels of the mark. Color representation: Light blue indicates low levels of enrichment whereas darker blue is representative of high levels and specific localization in foci (dots in the diagram). Nucleolar-like bodies (NLBs) in the oocyte, zygote, and 2-cell stage embryos are shown as red circles in the nucleus.
