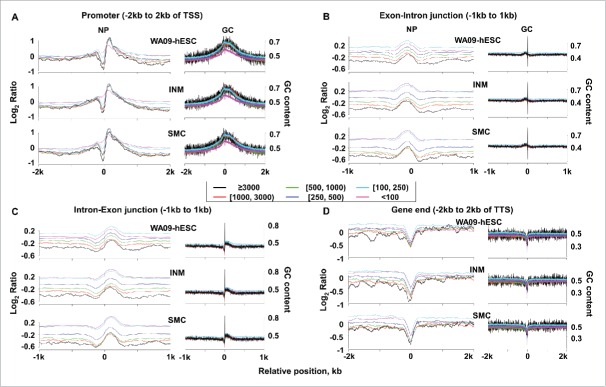
Figure 2.
Nucleosome occupancy at promoters and other genic sites correlates with transcript abundance levels. Nucleosome occupancy and G+C content at promoters (A), exon-intron and intron-exon junctions (B and C), and gene ends (D) are shown. In each panel, genes were divided into 6 groups, represented by the 6 colors as shown, based on their expression intensities from microarray analyses (Table S2B). Genes in each group were then aligned at the indicated positions (e.g., 2 kb upstream and downstream of the TSS). Plots on the left present the average nucleosome occupancy level (Table S2C), represented by the nucleosomal DNA density normalized against the randomly sheared genomic DNA density of WA09-hESC in log2 scale (see Materials and Methods), at each base position shown along the X-axis. Plots on the right denote the average G+C content of the corresponding sequence (Table S2E). See also Fig. S2.

