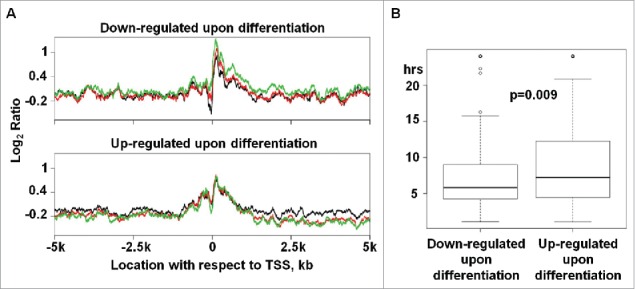
Figure 3.

Genes being silenced upon WA09-hESC differentiation display substantial promoter NDR changes and appear to have a shorter mRNA-half life. (A) Top panel presents the average nucleosome occupancy for genes, 118 in total, that are downregulated by >2-fold upon differentiation and have expression intensity of > 500 in WA09-hESC (black) but of < 500 in both INM (red) and SMC (green). Bottom panel presents the average nucleosome occupancy for genes, 240 in total, that are upregulated by ≥ 2-fold upon differentiation and have expression intensity of < 500 in WA09-hESC but of > 500 in both INM and SMC. The average nucleosome occupancy was calculated as described in Fig. 2. See also Table S3A-B and Figs. S4–5. (B) The mRNA half-life distribution of the same downregulated and upregulated genes shown in A (see also Table S3C).
