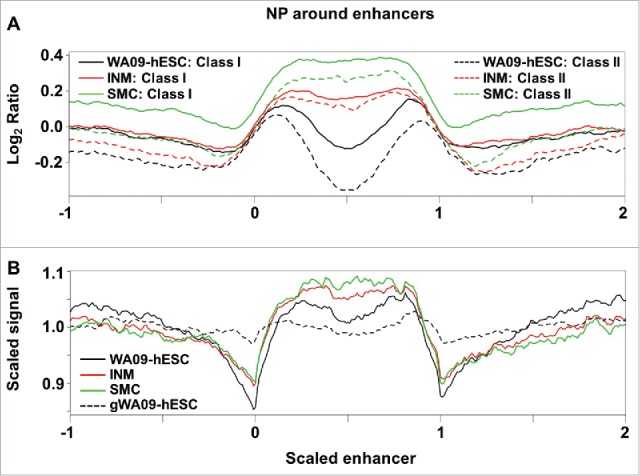
Figure 4.

Reported hESC enhancers have the lowest nucleosome occupancy level in WA09-hESC. (A) The nucleosome occupancy level, as defined in Fig. 2, was plotted against scaled enhancer regions of 5,118 putative active enhancers, labeled as “Class I”, and 2,287 poised enhancers, labeled as “Class II”, previously reported46 for WA09-hESC. Scaled enhancer regions are built by treating the entire length of each enhancer as 1 and then expanding to −1 upstream and +1 downstream regions, represented by 0–1, −1–0, and 1–2 respectively in the X-axis. The combined region was then divided into 300 windows, and the average nucleosome occupancy level, represented by the log2 ratio of the Y-axis, was calculated for each window (see Materials and Methods). (B) A total of 7,006 enhancers reported47 for WA01-hESC (H1) were plotted as described.38 Scaled signal, shown in the Y-axis, was obtained by calculating the average fragment coverage in each window as defined in (A) and then performing linear transformation by setting the mean coverage of all windows to 1.
