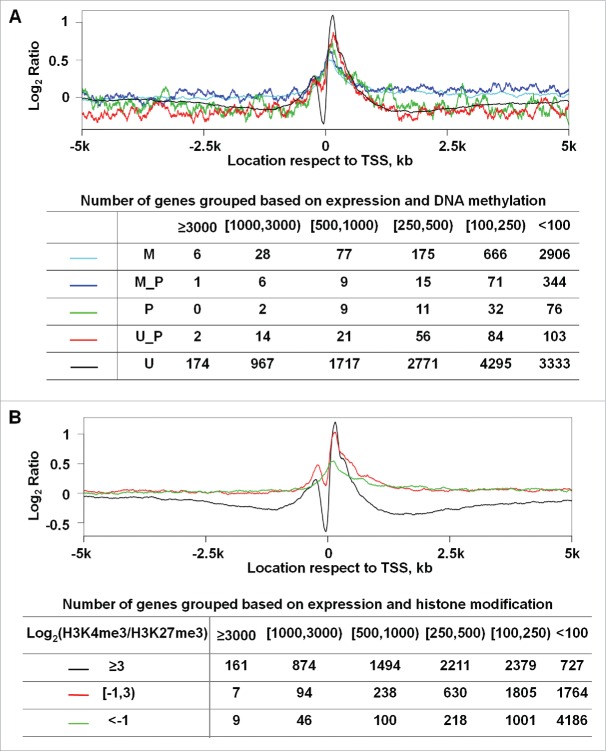
Figure 5.
NP at promoters matches published CpG methylation and H3K4me3/H3K27me3 enrichment status in WA09-hESC. (A) Genes were sorted into 5 groups based on their promoter CpG methylation status. Briefly, the methylation data of each CpG within a promoter were obtained from a published study,13 and the promoter status was determined based on the methylation data of all its CpGs. Methylated (M), between methylated and partially methylated (M_P), partially methylated (P), between partially methylated and unmethylated (U_P), or unmethylated (U) correspond to > 80%, 60–80%, 40–60%, 20–40%, or < 20% of the promoter CpGs being methylated respectively. (B) Genes were sorted into 3 groups based on their relative enrichment with H3K4me3 and H3K27me3 as shown, with of ≥ 3, between 3 and −1, and < −1, which largely correspond to open, poised, and closed promoters. For the plot in each panel, the Y-axis represents the average nucleosome occupancy and the X-axis indicates the base pair position, as described in Fig. 2. The table in each panel shows the total number of genes further classified based on their expression intensity (the top row) for each group indicated in the corresponding plot above.

