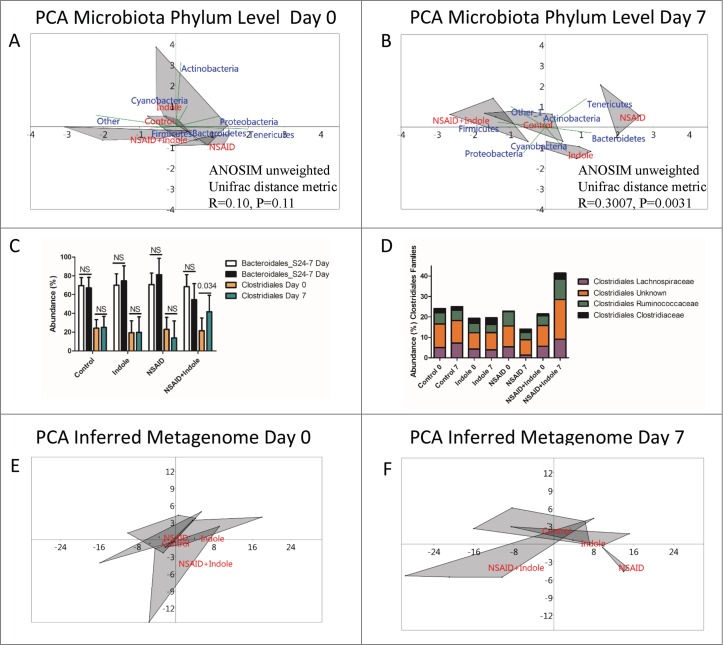
Figure 2.
Indole increases abundance of Clostridiales and prevents NSAID-induced shift of the microbiota and inferred metagenome. A) Principal component analysis (PCA) plots of 16S rRNA sequencing of the fecal microbiota at the phylum level with biplot overlay and ANOSIM based on the unweighted Unifrac distance metric (located in the lower right quadrant) of the OTU table from day 0 revealed no significant differences among the groups at day 0.The area of the gray shaded shapes reflects the variation among individuals in a group: the larger the shaded area, the more variation among the individuals in that group. B) Principal component analysis (PCA) plots of 16S rRNA sequencing of the fecal microbiota at the phylum level with biplot overlay and ANOSIM based on the unweighted Unifrac distance metric (located in the lower right quadrant) of the OTU table from day 7 reveal that there is a significant difference among the groups at day 7. After 7 days, the NSAID group is significantly shifted from the other 3 groups, and this shift was associated with a qualitative increase in the phylum Bacteroidetes and loss of Firmicutes. C) Abundance of Clostridales from Day 0 (orange) and Day 7 (green) and Bacteroidales Day 0 (white) and Day 7 (black). Error bars represent the upper bound of the symmetrical 95% confidence intervals about the mean of the 5 animals in each group and P values displayed on the graph are corrected for multiplicity of comparisons by the method of Sidak. Clostridiales were significantly increased on Day 7 relative to Day 0 by co-administration of indole with the NSAID indomethacin. D) Mean abundance of several families of Clostridiales at Day 0 and Day 7 for each of the treatment groups depicting reduction of these families following NSAID therapy but expansion indole is co-administered. E) PCA plots of inferred metagenome of the fecal microbiota from Day 0. ANOSIM based on the Bray Curtis distance measure revealed no significant difference among the groups at day 0. F) PCA plots of inferred metagenome of the fecal microbiota from Day 7. ANOSIM based on the Bray Curtis distance measure revealed that, consistent with the microbiota data, the NSAID group visually separated from the other groups; however, this apparent difference was not significant (P > 0.05 by ANOSIM based on Bray Curtis dissimilarity measure).

