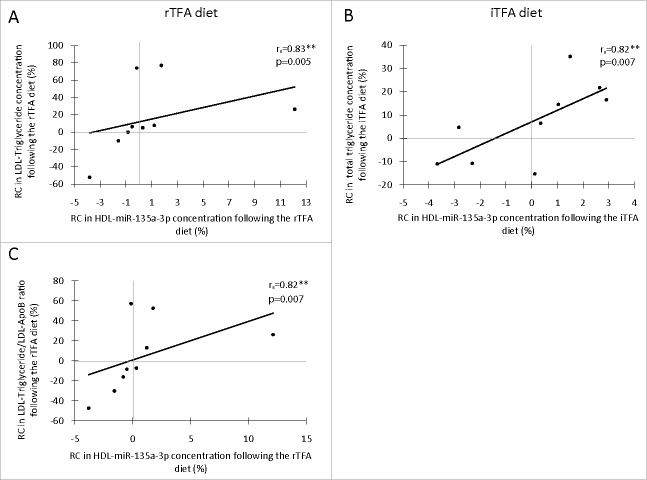
Figure 3.
Spearman's Rank Correlation between rate of change (RC; %) in HDL-carried miRNA concentration and blood lipid profile (other than HDL)-related phenotypes following a diet rich in TFAs (n = 9). Correlation between LDL-triglyceride and HDL-carried has-miR-135a-3p concentration following the rTFA diet (A), correlation between total triglyceride and HDL-carried has-miR-135a-3p concentration following the iTFA diet (B), and correlation between LDL-triglyceride/LDL-ApoB ratio and HDL-carried has-miR-135a-3p concentration following the rTFA diet (C). Significance: *P ≤ 0.05, ** P ≤ 0.01. ApoB: apolipoprotein B100 from the LDL fraction; iTFA: diet rich in trans fatty acids from industrial source; LDL-TG: triglycerides from the LDL fraction; RC: rate of change (%); rTFA: diet rich in trans fatty acids from ruminant.

