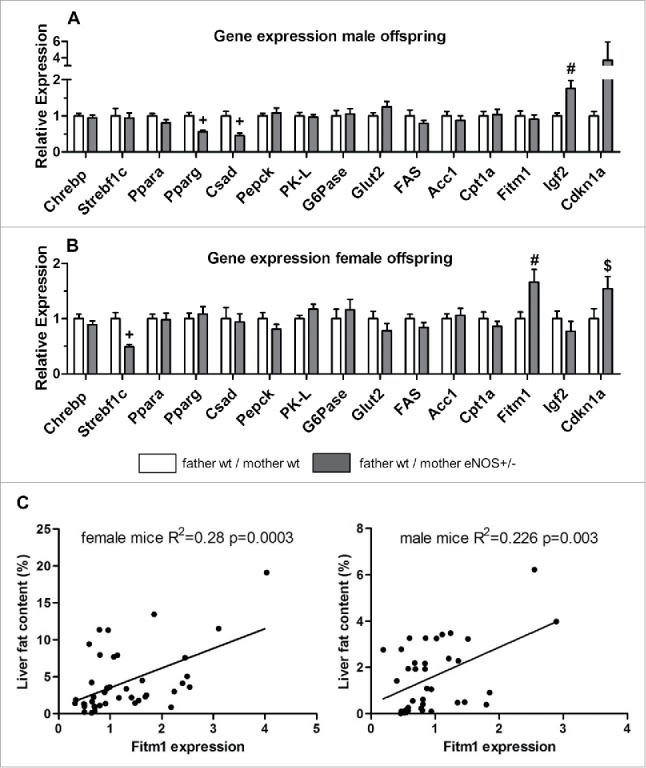
Figure 6.

Gene expression in wt offspring. Gene expression (fold expression compared to reference group) was analyzed by real time PCR of (A) male and (B) female wt offspring. (C) Correlation of hepatic Fitm1 gene expression and liver fat content (empty bar, wt father / wt mother; gray bar, wt father / eNOS+/− mother; $ P < 0.05 vs. wt father / wt mother; # P < 0.01 vs. wt father / wt mother; + P < 0.001 vs. wt father / wt mother).
