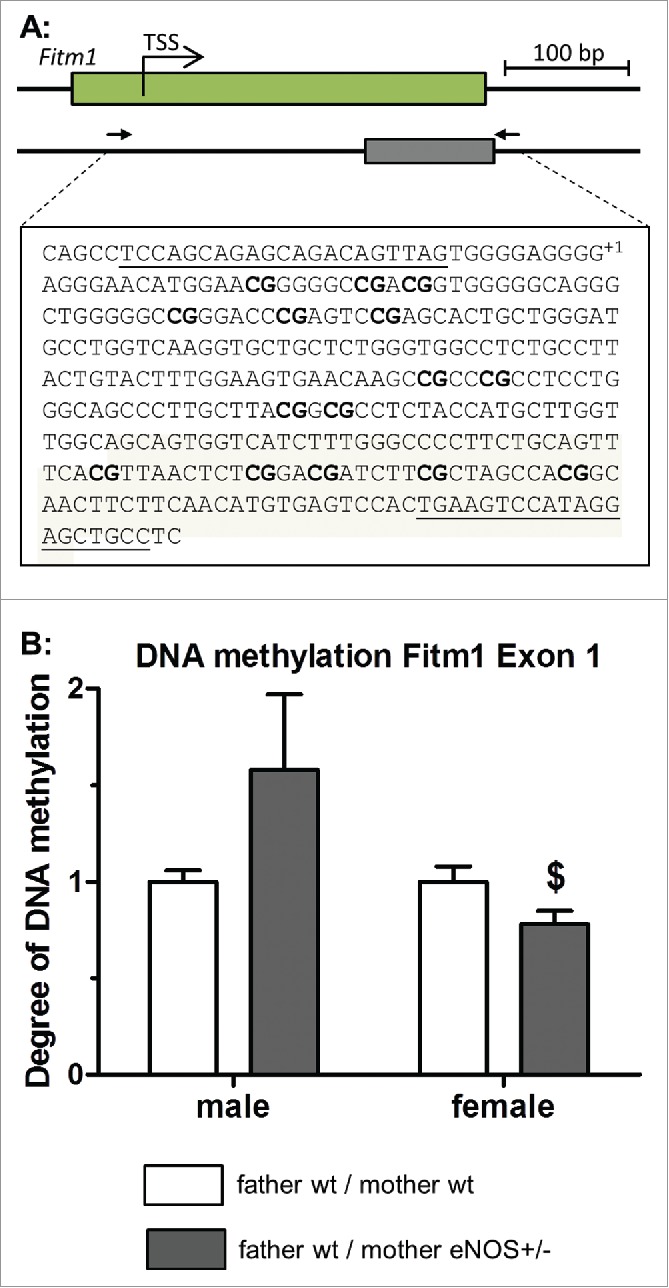
Figure 9.

MeDIP DNA methylation analysis of Fitm1 gene. (A) Genomic organization of Fitm1 exon 1, putative transcription start site (TSS), and position of identified CpG island. Amplified sequence is shown in detail (primer binding sites in bold letters and analyzed CpG dinucleotides bold / underlined, TSS indicated with +1), (B) degree of DNA methylation of Fitm1 exon 1 in liver tissue of wt offspring (empty bar, wt father / wt mother; gray bar, wt father / eNOS+/− mother; $ P < 0.05 vs. wt father / wt mother).
