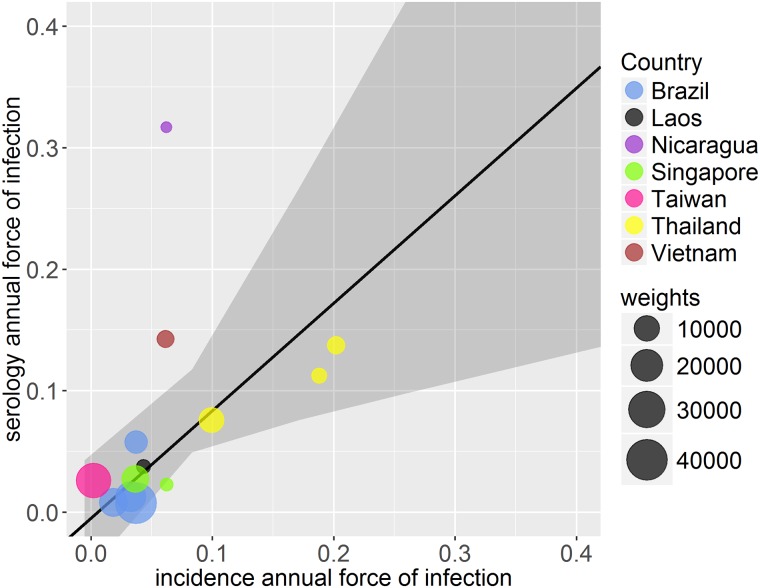
Fig 4. Comparison of weighted deming regression of force of infection estimates by country from cumulative incidence data and seroprevalence data.
Each point is weighted depending on the error in both serology and incidence estimates, represented by the size of circles (larger circles indicating greater weight, i.e. smaller error).

