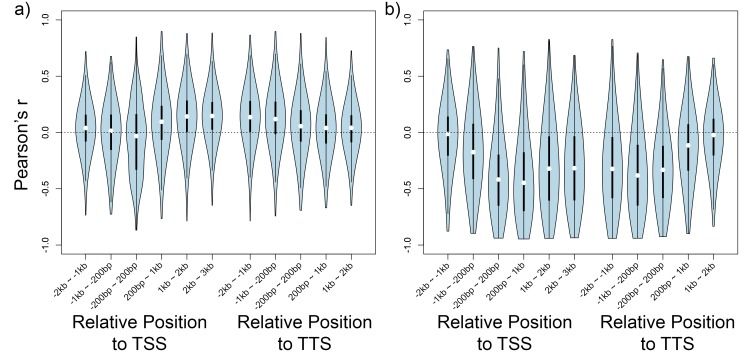
Fig 1. Correlation between DNA methylation level and expression across individuals.
Correlation is shown with violin plots as distribution of Pearson’s r along genes. a) Genes most strongly associated with a CG-only methylation variant. b) Genes most strongly associated with a C methylation variant. TSS and TTS are transcription start sites and transcription termination sites, respectively.

