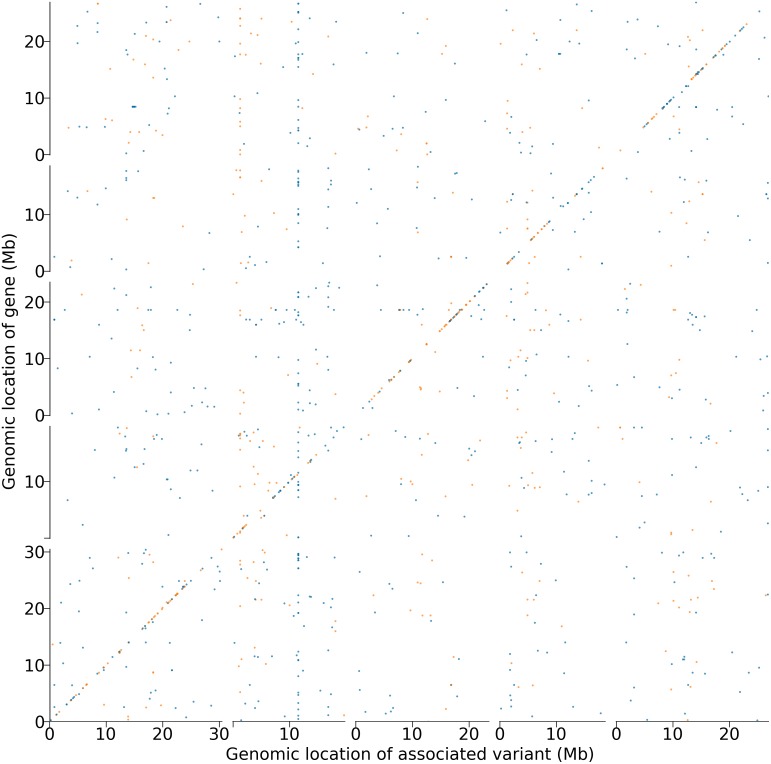
Fig 2. Genome-wide associations between expression and DNA methylation variation.
For each gene, results are merged in 10 kb windows and a dot is plotted whenever the window contains at least one significantly associated variant (using a Bonferroni-corrected 5% threshold). Blue dots indicate CG-only methylation; orange C methylation.

