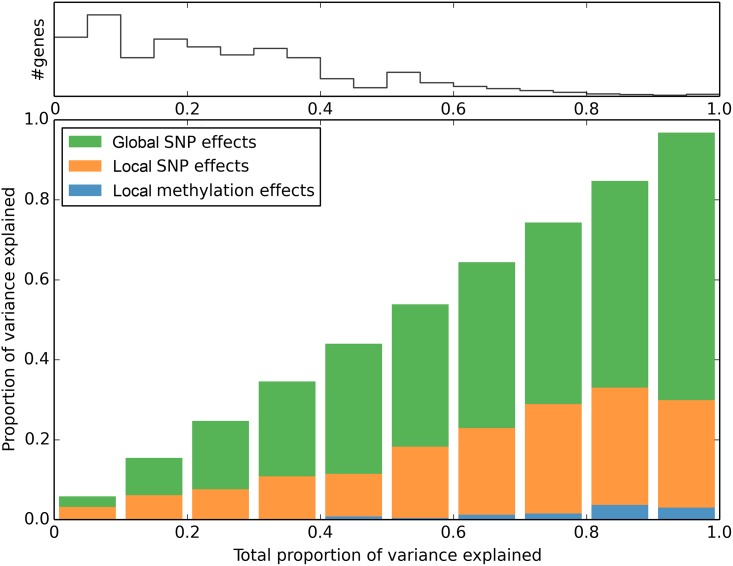
Fig 5. Partition of variance explained by local (cis) and global (trans) SNP effects, and by cis methylation effects for all expression traits.
Traits are binned by the total variance explained, colored bars showing the average partitioning of the variance in each bin. The number of traits/genes in each bin is shown in the density plot on top.

