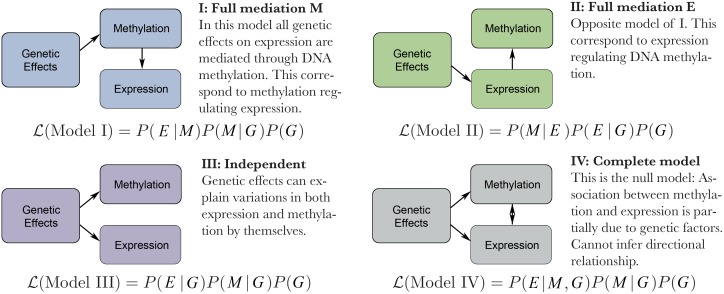
Fig 6. Description of causal models.
Here denote the likelihood of each model given data at each gene and P is the probability or conditional probability of individual measurements, M is the DNA methylation level and E is the expression level. Genetic effect include both fixed and random effects. For details see Methods.

