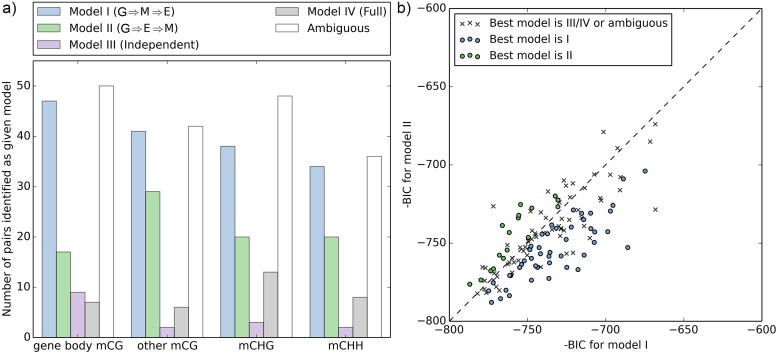
Fig 7. Comparison of causal models for methylation and expression variation.
a) The number of genes identified as fitting a particular causal model (I-IV) significantly better, or as ambiguous (BIC difference between best and second best smaller than 3). b) BIC comparison for Models I and II, for GBM. Lower values correspond to a better fit to the model in question. For other types of methylations (e.g. CHG methylation), see S6 Fig.

