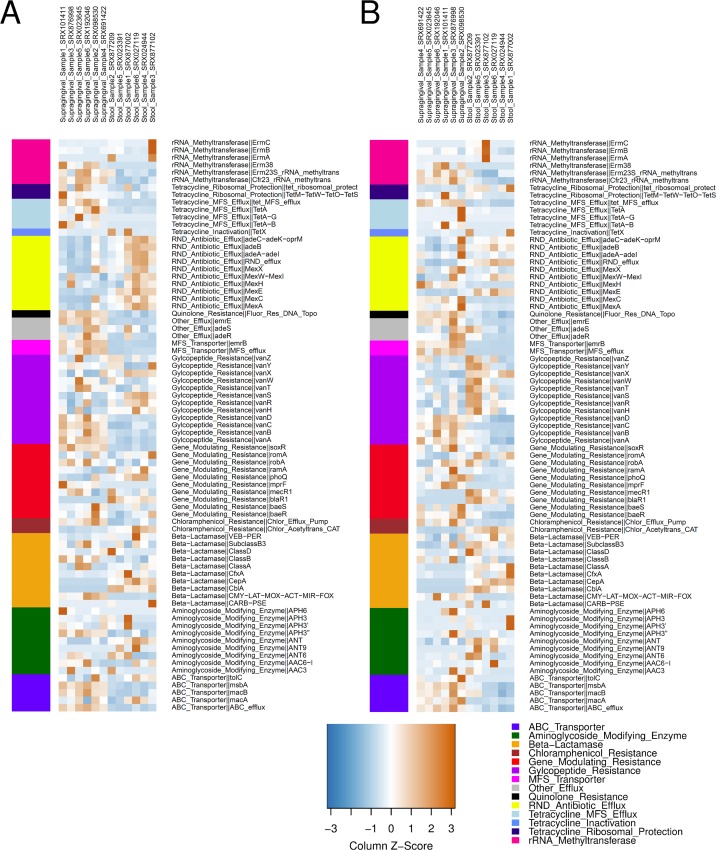
Fig 2. AMR protein-family profiles from the six supragingival and six stool samples as predicted by HMM-GRASPx and HMMER3.
(A) AMR Profile predicted by HMM-GRASPx. (B) AMR Profile predicted by HMMER3. Hierarchical clustering was performed sample-wise (column-wise). Color bars on the left-hand-sides of the heat maps indicate AMR classification by RESFAM (bottom right legend). Abundance values (RPKM) were row-wise normalized into Z-scores (bottom right color key).

