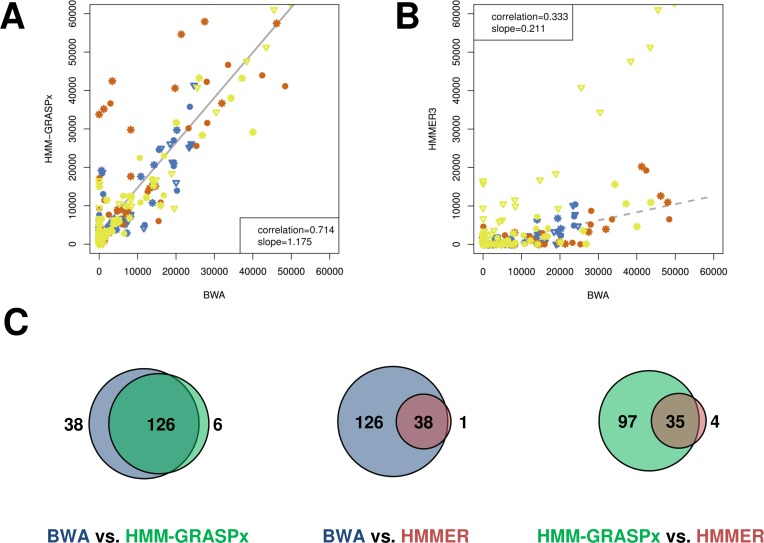
Fig 3. Comparison of HMM-GRASPx- and HMMER3-generated results from the in vitro human oral plaque biofilm MT data set.
(A) Abundances correlation between HMM-GRASPx predictions and the ground-truth (i.e. BWA). The x- and y-axis indicate the number of homologous reads recruited by the corresponding programs. Colors indicate different conditions where the libraries were constructed (blue for 0hr/pH 7.0, red for 6hr/pH 4.2, and yellow for 9hr/pH 5.2). Different marks indicate different replicates. (B) Abundances correlation between HMMER3 predictions and the ground-truth. (C) Venn diagram showing the overlap between detected DE genes using HMM-GRASPx predictions (green), HMMER3 predictions (red), and the ground-truth homologous reads (blue).

