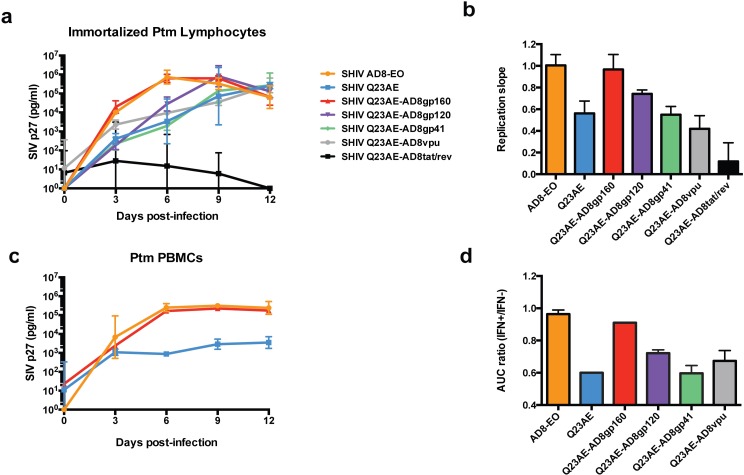
Fig 2. Analysis of chimeric SHIVs in Ptm cells.
(a) Replication kinetics of SHIV AD8-EO, SHIV Q23AE and chimeras (Q23AE-AD8gp160, Q23AE-gp120 and Q23AE-gp41, Q23AE-AD8vpu and Q23AE-AD8tat/rev) were determined by measuring SIV p27 levels over a 12-day time course in immortalized Ptm lymphocytes. The key at the right indicates the color corresponding to each SHIV tested. Data points represent the average of two independent experiments, and error bars represent SD. (b) The slope of the replication curve in the first six days of infection immortalized Ptm lymphocytes of all chimeras generated were compared to those of SHIV AD8-EO and SHIV Q23AE. Bars represent the average replication slope of at least two independent experiments. (c) Replication kinetics of SHIV Q23AE-AD8gp160, SHIV AD8-EO and SHIV Q23AE in primary Ptm PBMCs. (d) Comparison of the area-under-curve (AUC) ratio among SHIV chimeras. AUC ratio was determined by dividing the AUC of the replication curve in IFNα treated cells by the AUC in untreated cells. AUC ratio (IFN+/IFN-) is plotted on the y-axis for each of the indicated chimeras. Data represent the average of at least two independent experiments, and error bars indicate the SD.

