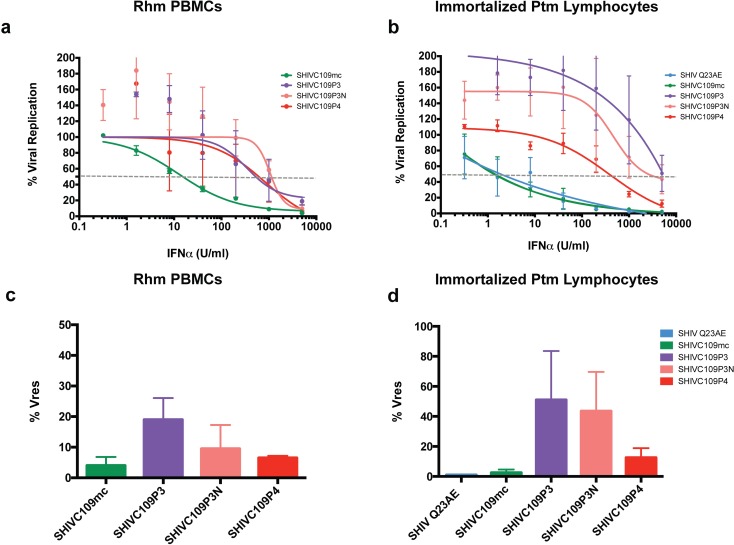
Fig 5. Assessment of IFNα sensitivity by IFN IC50 assay.
Dose-dependent inhibition of viral replication by IFNα. Viral replication as a percentage of replication in untreated Rhm PBMCs (a) or immortalized Ptm lymphocytes (b) is plotted vs. concentration of IFNα-2a (U/ml). Data for the un-adapted, parental clone (SHIVC109mc) and macaque-passaged isolates (SHIVC109P3, SHIVC109P3N and SHIVC109P4) are presented. SHIV Q23AE serves as a positive control for IFN-induced inhibition. Each data point represents the average of two independent experiments. Data are fitted to a non-linear curve using Prism Graphpad version 6.0c. The dashed grey line indicates 50% inhibition of viral replication used to determine the IC50 value. Comparison of % residual viral replication (Vres) at the highest concentration of IFNα-2a (5000 U/ml) between SHIVC109 isolates in RhmPBMCs (c) and immortalized Ptm lymphocytes (d). Data represent the average of two independent experiments, and error bars represent the SD.

