
Figure 4.
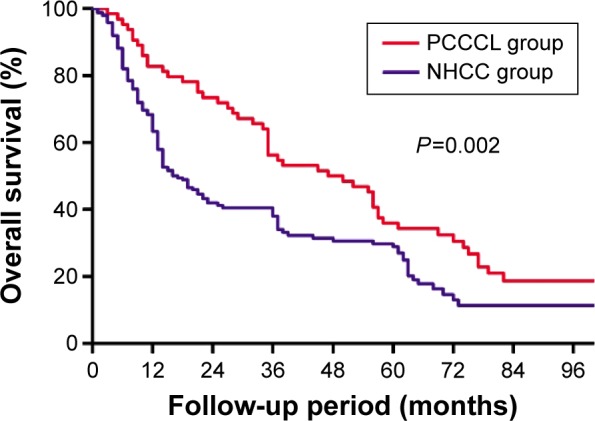
Comparison of the overall survival curves between primary clear cell carcinoma of the liver (PCCCL group) and nonclear cell hepatocellular carcinoma (NHCC group).
Notes: Results are in response to Kaplan–Meier analysis. P-values<0.05 were considered to be statistically significant.