
Figure 7.
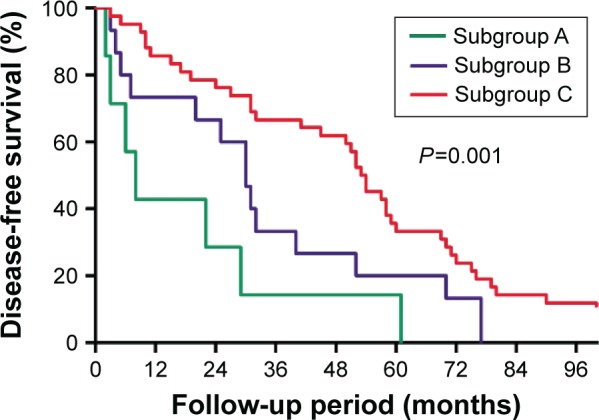
Comparison of the disease-free survival curves of subgroup A (proportion of clear cells >30% but ≤50%), subgroup B (proportion of clear cells >50% but ≤70%), and subgroup C (proportion of clear cells >70%).
Notes: Results are in response to Kaplan–Meier analysis. P-values<0.05 were considered to be statistically significant.